88
Intel RAID Controller SRCU32 User’s Guide
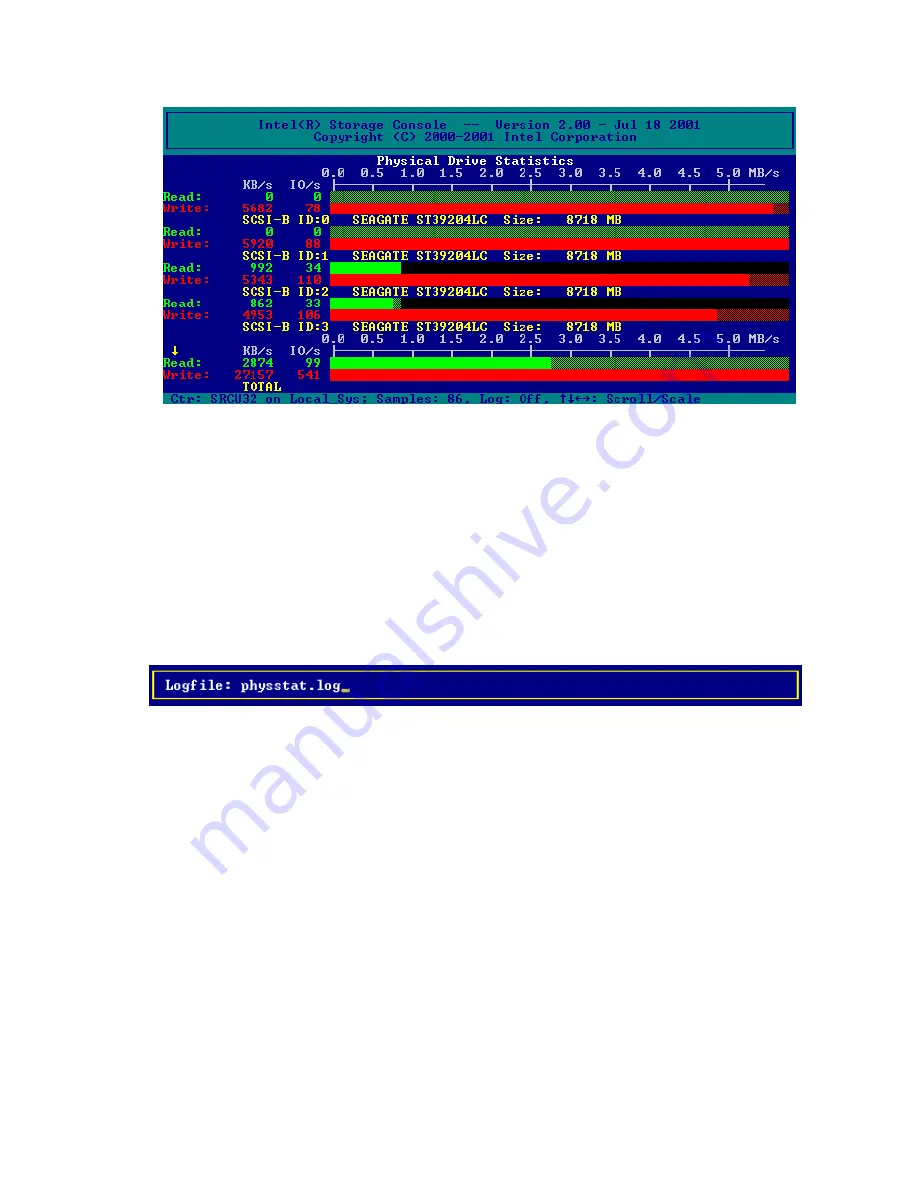
Figure 19. Physical Drive Statistics
Use “Cache Statistics” to view the utilization of the Intel RAID Controller SRCU32’s caches (read
cache and write cache). This menu also displays the size of the cache in KB and the settings of
both caches (on or off). The figures for “cache hits” show how often requests can be serviced out
of the cache, for example, without triggering an immediate disk I/O.
Use “Sample Rate,” to choose the interval at which the Intel RAID Controller SRCU32 delivers
new measurements. Depending on the operating system used, the sampling rate can be set to a
maximum of 60 seconds. The default setting is 1 second.
Use “Logging On/Off,” to create a log file which records all the statistical values over a longer
period. If you choose On, StorCon asks for the path/name of the log file. See Figure 20.
Figure 20. Logfile Name
View Events
Use “View Events” to display Intel RAID Controller SRCU32 events. Events can also be recorded
and saved into a log file. This menu option gives the administrator the ability to analyze and
supervise array drives. See Figure 21.
Summary of Contents for SRCU32 - RAID Controller
Page 1: ...Intel RAID Controller SRCU32 User s Guide Order Number A77949 004 ...
Page 35: ...Getting Started 35 Figure 9 Operational State Diagram for RAID 4 5 ...
Page 46: ......
Page 62: ...62 Intel RAID Controller SRCU32 User s Guide ...
Page 76: ...76 Intel RAID Controller SRCU32 User s Guide ...
Page 109: ...Storage Console 109 Figure 49 Block Diagram of a SAF TE Subsystem ...
Page 122: ......
Page 164: ...164 Intel RAID Controller SRCU32 User s Guide Figure 106 StorCon Help ...
Page 167: ...Storage Console Plus 167 Figure 109 RAID Configuration Service Add Remove Users ...
Page 170: ...170 Intel RAID Controller SRCU32 User s Guide ...


