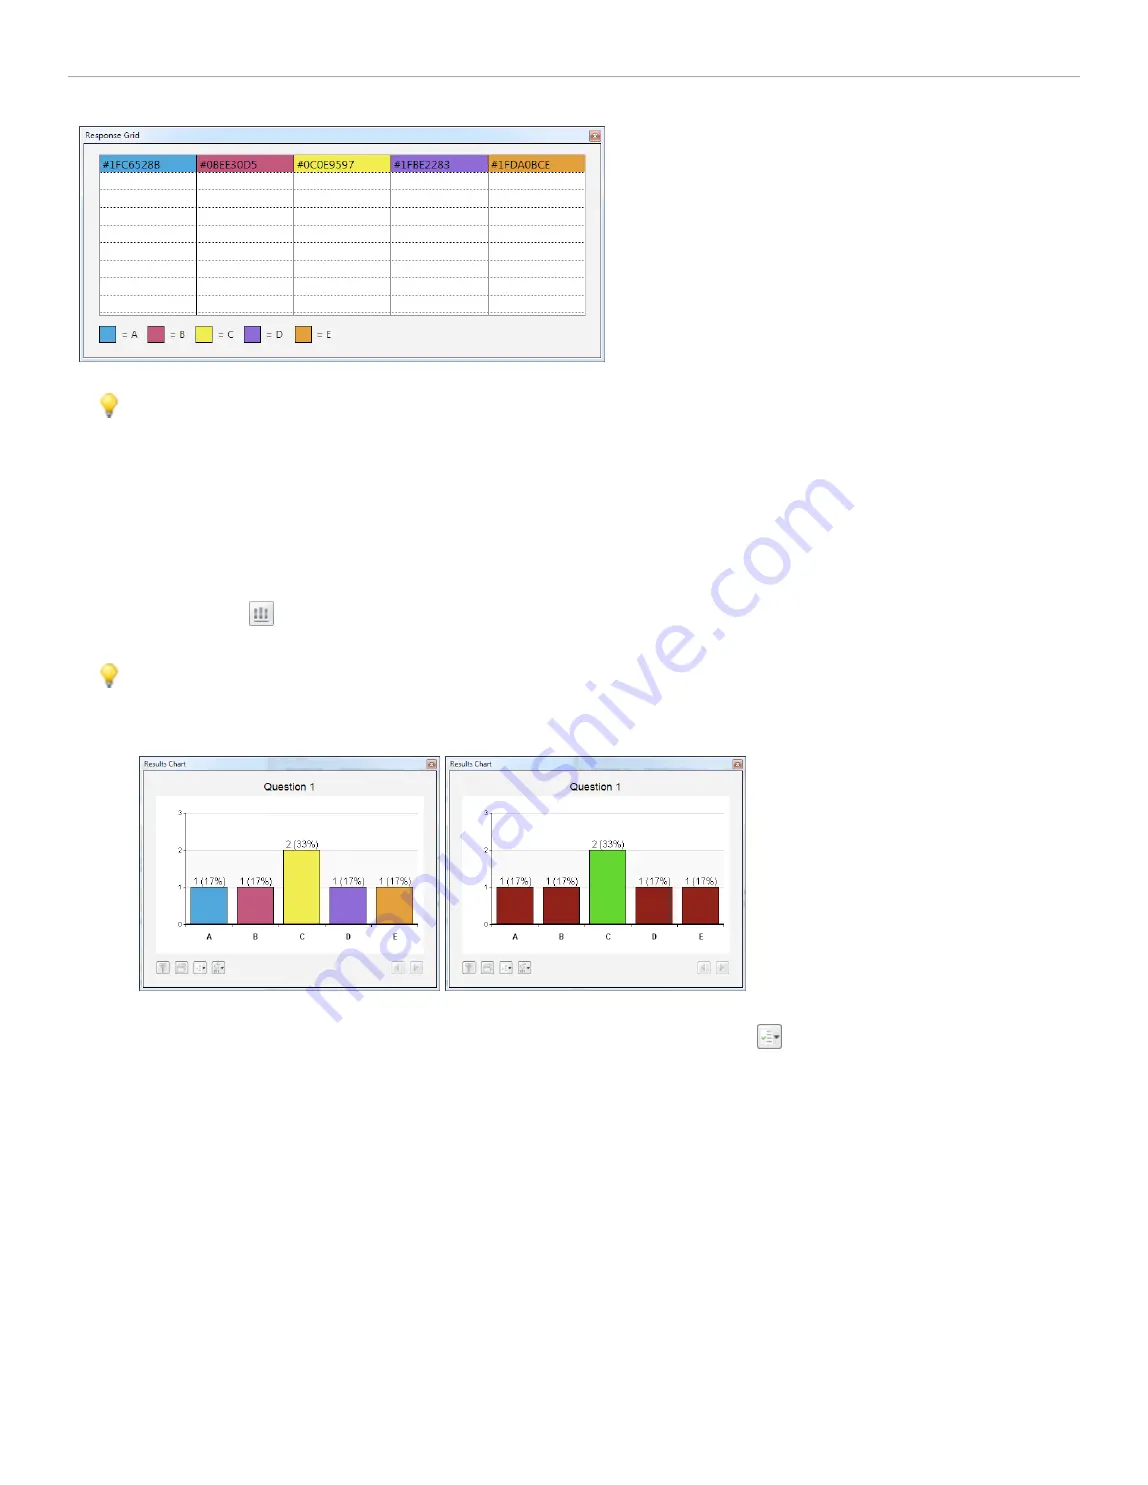
Response Grid showing answer choices from five i>clicker remotes
TIP:
During polling, your students can freely change their votes at any time until you select
Stop
(their last
vote is recorded). Students may use the color coding if you show response choices to quickly identify the most
popular answer and change their vote in response. This behavior could both skew your question data and also
impact your performance points assignments. If you are assigning performance points for a correct answer in
your sessions, you may not want to choose the
Confirm response was received and show response choice
option.
Results Chart
During polling, a graph displays the results of each question in your session. The graphs can be displayed by clicking
the
Results
button
on the i>clicker
Session Toolbar
or pressing
B
on the
instructor's remote
. The
Show chart as
setting allows you to select whether the chart displays as multicolor
Results Chart
when polling.
TIP:
For either display option, if you designate a correct answer choice and display the chart, the bar will
appear in green and the remaining bars will turn red. See the example below (the left example is the colored
version without a correct answer designated; the right example is the same colored version with a correct
answer of C).
Results Chart with no correct answer selected and with a correct answer selected
To stop displaying the correct answer, click the
Correct Answer
button
and select
<None>
, or if you are
using the
instructor's remote
function to toggle a correct answer, toggle through all options until the graph no
longer shows the correct answer.
i>clicker 6 User Guide
16


