

iSXblue/SXBlue II GNSS Series Technical Reference Manual
44
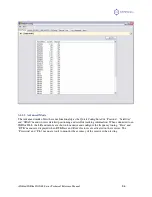
2.6
Post Processing
The iSXBlue/SXBlue II receiver is able to output raw measurement data for post processing applications.
The raw measurement and ephemeris data are contained in various binary messages documented in
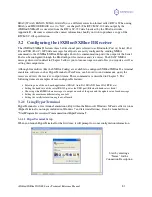
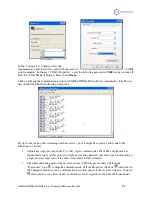
chapter 6. Messages must be logged in a binary file (SXBlue Config allows logging of raw binary data).
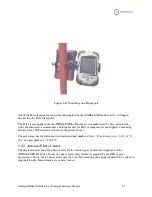
For cm-level post-processing, a survey grade L1/L2 GNSS antenna with ground plane is highly
recommended and software that processes the carrier phase like EZSurv should be used.
A RINEX translator is available; however, RINEX has no facility to store station information. Please
contact Geneq if you wish to use this utility. Off-the-shelf software is available for collecting and post-
processing iSXBlue/SXBlue II raw data.
Various types of post-processing can be performed: Static, semi-kinematic, kinematic, code-phase, phase,
using L1 only or L1/L2, GPS only or GPS/GLONASS, with a local base station or using PPP. Refer to
the post-processing software documentation for recommended occupation times to achieve the highest
possible performance.
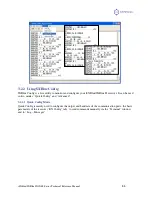
2.7
Evaluating the iSXBlue/SXBlue GNSS II Performance
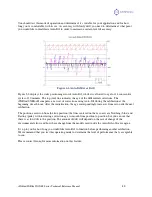
The iSXBlue/SXBlue II receiver performance has been evaluated with the objective of determining best-
case performance in a real-world environment. Static testing has shown that the iSXBlue/SXBlue II
achieves a performance better than 60cm 95% of the time when using SBAS signal (WAAS, EGNOS,
GAGAN or MSAS)
The qualifier of 95% is a statistical probability. Often you may see manufacturers using a probability of
‘rms’ or standard deviation. Performance measures with these probabilities are not directly comparable to
a 95% measure since they are a lower probability (less than 70% probability). This means that less often,
a product would position within a radius of the prescribed amount.
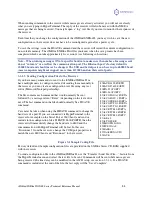
The following table summarizes the common horizontal statistical probabilities.
Table 2-2 Horizontal Accuracy Probability Statistics
Accuracy Measure
Probability (%)
Rms (root mean square)
63 to 68
CEP (circular error probability)
50
2drms (twice the distance root mean square)
95 to 98
R95 (95% radius)
95
It is possible to convert from one statistic to another using the following table. Using the value where the
‘From’ row meets the ‘To’ column, multiply the accuracy by this conversion value.