387
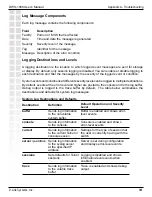
DWS-1008 User’s Manual
D-Link Systems, Inc.
Appendix A - Troubleshooting
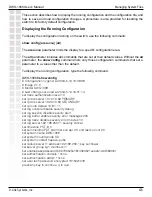
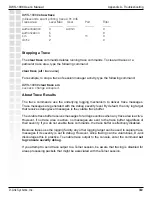
DWS-1008#
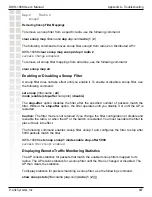
save trace traces/trace1
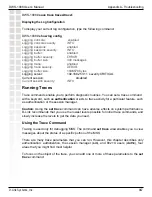
Displaying the Log Configuration
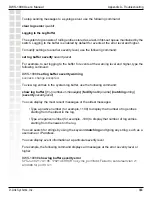
To display your current log configuration, type the following command:
DWS-1008#
show log config
Logging console:
enabled
Logging console severity:
INFO
Logging sessions:
enabled
Logging sessions severity:
INFO
Logging buffer:
enabled
Logging buffer severity:
ERROR
Logging buffer size:
400 messages
Logging trace:
enabled
Logging trace severity:
DEBUG
Logging buffer size:
1048576 bytes
Logging server:
192.168.253.11 severity CRITICAL
Current session:
disabled
Current session severity:
INFO
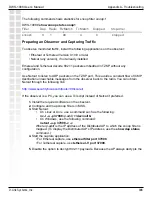
Running Traces
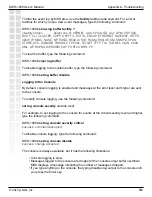
Trace commands enable you to perform diagnostic routines. You can set a trace command
with a keyword, such as
authentication
or
sm
, to trace activity for a particular feature, such
as authentication or the session manager.
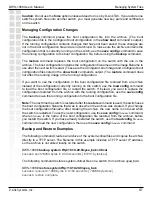
Caution:
Using the
set trace
command can have adverse effects on system performance.
D-Link recommends that you use the lowest levels possible for initial trace commands, and
slowly increase the levels to get the data you need.
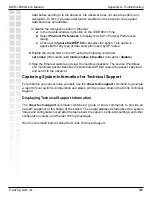
Using the Trace Command
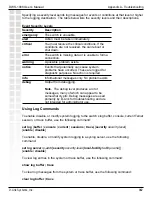
Tracing is used only for debugging MSS. The command
set trace
area
enables you to view
messages about the status of a specific portion of the MSS.
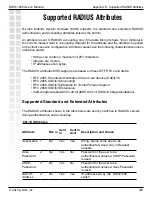
There are many trace parameters that you can run. However, this chapter describes only
authentication, authorization, the session manager (
sm
), and 802.1X users (
dot1x
), four
areas that you might find most helpful.
To focus on the object of the trace, you can add one or more of these parameters to the
set
trace
command:
Summary of Contents for DWS-1008
Page 1: ......

