Section 5. Real-Time Tools
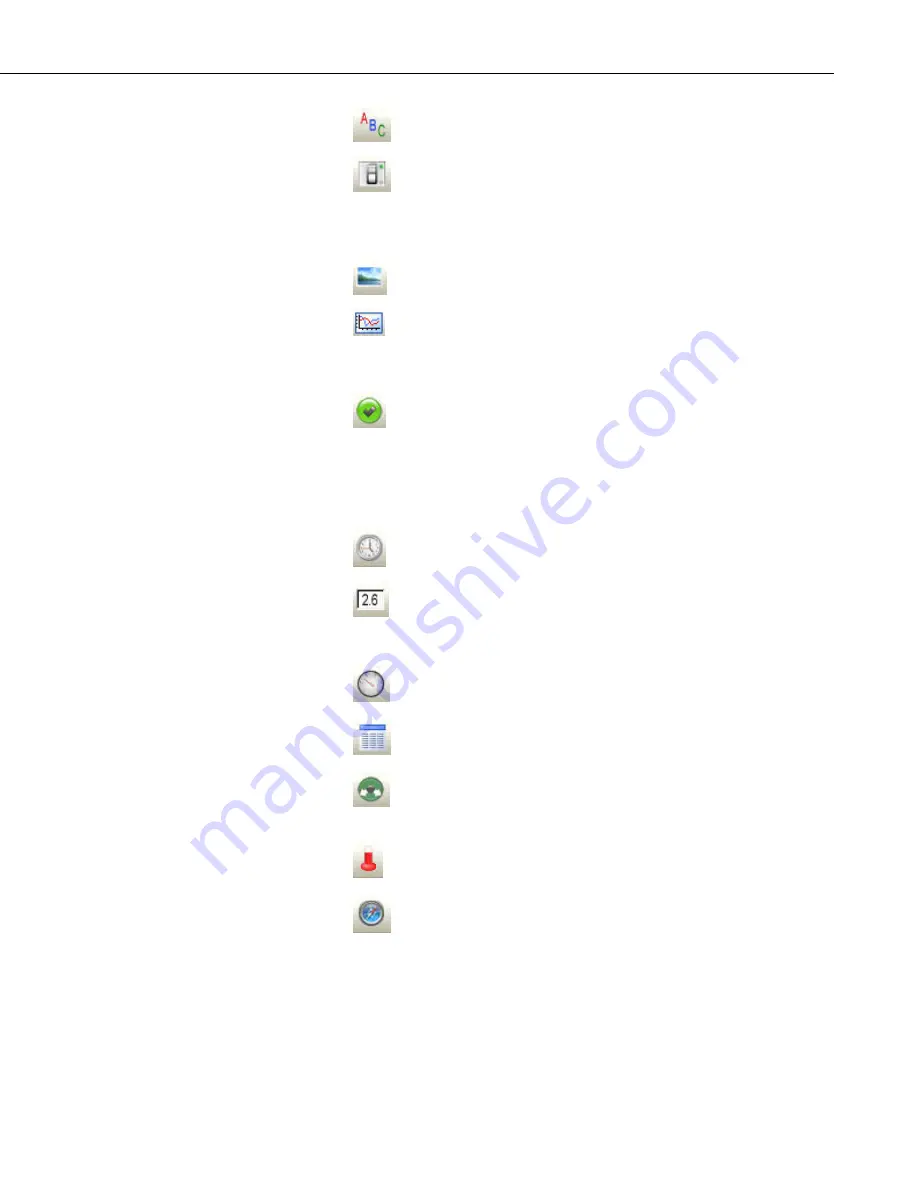
Label
displays a text string that can be used to label other
components.
Switch
indicates the state of a port, flag, input location, or Boolean
value. A 0 is considered Off (false); any non-zero number is
considered On (True). In run-time mode, right-click a switch to
change its state. The option to change the state of a switch with a
double-click can be enabled in the Properties window.
Image
allows you to place a static image on the display.
Chart
displays one or more traces on a line graph. The time stamp on
the X axis reflects the server clock. Note that a difference in the
server clock and the datalogger clock, coupled with a small time
window for the chart, could result in no data being displayed.
CommStatus Alarm
provides a visual and/or audible alarm when
scheduled collection is disabled in the Setup Screen, the schedule is
paused from the Status Monitor, or communication has failed a
sufficient number of times to put the datalogger into a Primary or
Secondary Retry mode (the retry mode used is based on the
Sensitivity property for the component). An audible alarm can be
disabled by right-clicking the component with your mouse.
Time
displays the server time, server time at last data collection,
station time, station time of last record stored, or PC time.
SetPoint
depicts the selected data value as a numeric value, text
string, or Boolean. A data value can also be set to a new value by
double-clicking the component and entering a new value in the
resulting dialog box.
Gauge
displays the selected data value on a gauge.
Table Display
displays the data from a datalogger table in a row and
column format.
Value Forwarder
reads a value in a datalogger and writes to another
value in that datalogger or a different datalogger. The value that is
written can be the value read, a 0 or –1, or a specified constant.
Thermometer
displays the data value on the image of a
thermometer.
Compass
provide an eight-point compass on which to display data.
5.2.1.3 Functions Available from the RTMC Menus
All of the RTMC operations are available from the menus at the top of the
Development window. Many of the options are also available as buttons on the
toolbar, or by right clicking the components or other parts of the window.
5-39
Summary of Contents for LoggerNet
Page 2: ......
Page 30: ...Preface What s New in LoggerNet 4 xxvi...
Page 32: ...Section 1 System Requirements 1 2...
Page 44: ...Section 2 Installation Operation and Backup Procedures 2 12...
Page 136: ...Section 4 Setting up Datalogger Networks 4 80...
Page 227: ...Section 7 Creating and Editing Datalogger Programs 7 9...
Page 298: ...Section 7 Creating and Editing Datalogger Programs 7 80...
Page 402: ...Section 9 Automating Tasks with Task Master 9 12...
Page 406: ...Section 9 Automating Tasks with Task Master 9 16...
Page 450: ...Section 11 Utilities Installed with LoggerNet Admin and LoggerNet Remote 11 22...
Page 454: ...Section 12 Optional Client Applications Available for LoggerNet 12 4...
Page 462: ...Section 13 Implementing Advanced Communications Links 13 8...
Page 482: ...Section 14 Troubleshooting Guide 14 20...
Page 570: ...Appendix F Calibration and Zeroing F 16...
Page 578: ...Appendix G Importing Files into Excel G 8...
Page 579: ......


