Operation
E164809_2_002
25 / 72
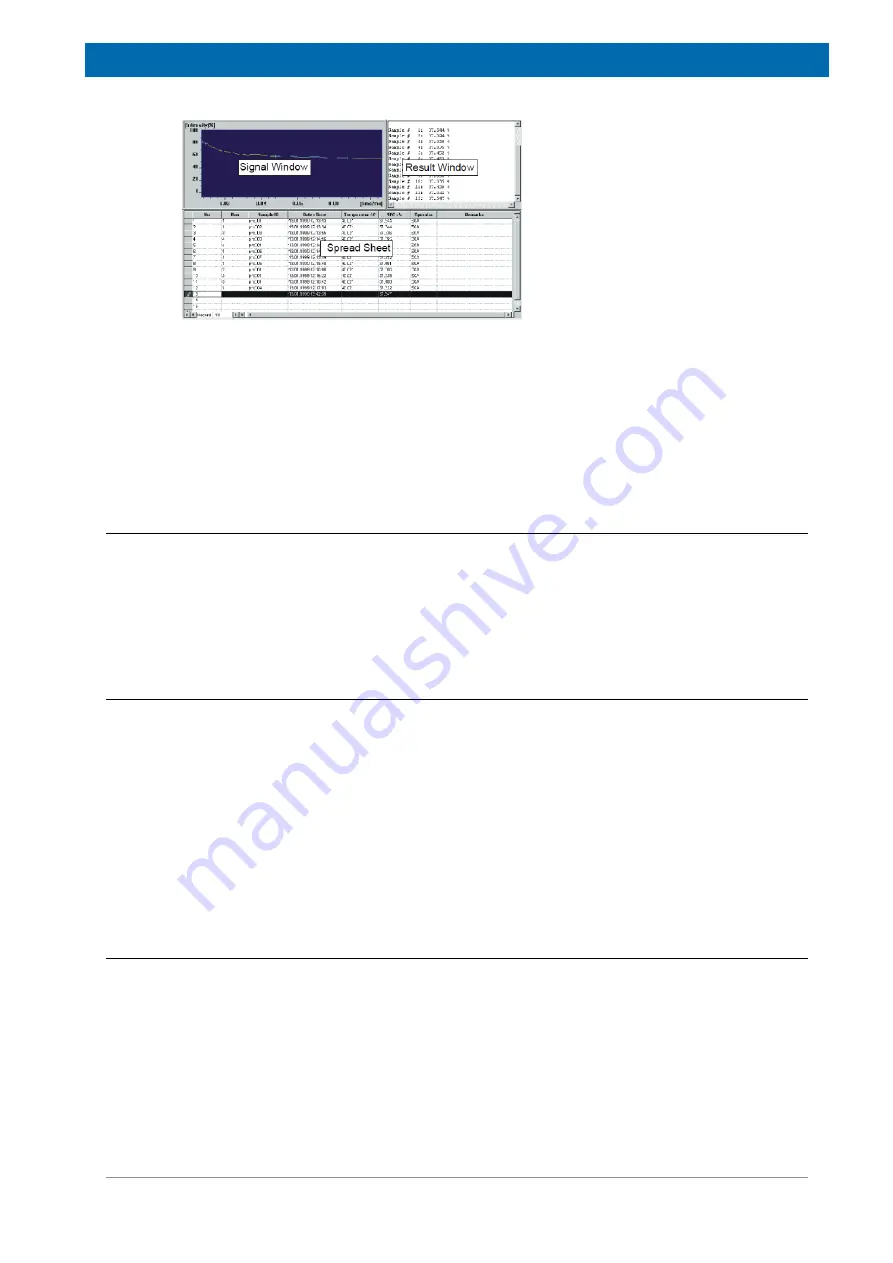
Figure 6.1: The View of the Signal Window, Result Window and the Spread Sheet.
For the pre-configuration of measurements and a simplified data output a
Spread sheet/
database Window
is integrated in some applications. Furthermore, the interface layout is
adjusted to the individual needs of the analysis for most of the recent standard application
fields.
The functionality of the windows, i.e. the possibility to move them, depends on the
analyzer type you are working in. Repositioning of bars and windows is only allowed
for the relaxation time and the NMR Analyzer.
6.2.3.1
The Signal Window
The Signal Window displays the measured NMR signal or the fit results graphically. In some
analyzer configurations (NMR and Relaxation configurations) the display can be resized.
Scaling of the data and the type of symbols used for the presentation of results can be
adjusted from the
View
pull-down menu, again depending on the analyzer type. Data
displayed in the
Signal
Windows can be saved to a file with the extension ‘
.sig
’ using the
command
Save
or
Save Copy As
from the pulldown menu
File
.
6.2.3.2
The Results Window
The
Result
Window is an output device for minispec applications that uses the ExpSpel
command
print_line(RESULTBOX,...)
to display a record of the evaluated result.
Results are printed in the
Result
Window in ASCII text format. The results can be stored
using the
Save
or
Save Copy As…
command
from the pull-down menu
File
. Contents of the
Result
Window are automatically saved at intervals to a file with extension
.mdt
). To
determine the parameters of the save procedure, use the command
Save Setup
in the pull-
down menu
Save
.
Result files can also be read with a common text editor. One can select and copy the data to
the clipboard as ASCII text with the command
Copy
in the pull-down menu
Edit
. To toggle
between the normal and the large font result box, mark / unmark
Large Font Result Box
from the
View
menu.
6.2.3.3
The Spreadsheet Window
Spreadsheets
have a number of functions in the minispec software:
• They allow a clear data input for the preparation of a measurement series.
• They give a listed view of the measurement results.
• They allow the data to be saved and post processed in common file formats (like MS
ACCESS/EXCEL).
• A spreadsheet will be displayed automatically if it is implemented in the loaded
application.
Summary of Contents for minispec LF Series
Page 1: ...minispec minispec LF series User Manual Version 002 Innovation with Integrity AIC...
Page 8: ...Introduction 8 72 E164809_2_002...
Page 13: ...Safety E164809_2_002 13 72 Figure 2 2 Example of a Stray Field Plot for the LF90 Top View...
Page 14: ...Safety 14 72 E164809_2_002...
Page 18: ...Transport Packaging and Storage 18 72 E164809_2_002...
Page 50: ...Operation 50 72 E164809_2_002...
Page 56: ...Maintenance 56 72 E164809_2_002...
Page 58: ...Replacement of Parts 58 72 E164809_2_002...
Page 64: ...Technical Data 64 72 E164809_2_002 Figure 12 1 An Example of a minispec Rating Plate...
Page 66: ...Contact 66 72 E164809_2_002...
Page 68: ...List of Figures 68 72 E164809_2_002...
Page 71: ...E164809_2_002 71 72...
Page 72: ...Bruker Corporation info bruker com www bruker com Order No E164809...


