


37
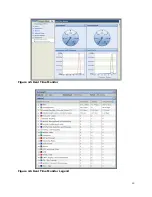
Another capability of RTM is the ability to correlate within the last hour to display the most
bandwidth consuming users. For example, in the above diagram RTM has HTTP as the
highest amount of traffic. If you right-click on this traffic, you will be presented with the
options to correlate by Directory User, Group, or Network Node.
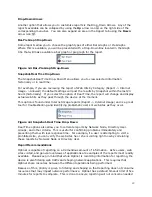
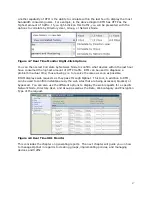
Figure 4.7 Real Time Monitor Right-Click Options
You can then select Correlate by Network Node to confirm what devices within the last hour
have consumed the highest amount of HTTP traffic. RTM can be used to diagnose a
problem in actual time; thus allowing you to resolve the issue as soon as possible.
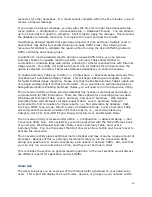
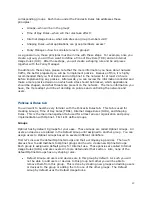
RTUM displays web requests as they pass through Optinet. This tool, in addition to RTM,
can be used to confirm instantaneously the web sites that are being accessed, blocked, or
bypassed. You can also use the different options to display the web requests for a specific
Network Node, Directory User, and Group as well as the Date, Web category and Encryption
Type of the request.
Figure 4.8 Real Time URL Monitor
This concludes the chapter on generating reports. The next chapter will guide you on how
to manage Optinet in regards to creating groups, implementing policies, and managing
devices and traffic.


