The Table Views: Call Paths, Functions, and Stack
ARM DUI 0482K
Copyright © 2010-2012 ARM. All rights reserved.
7-8
ID120712
Non-Confidential
7.5
Stack view column headers and the Maximum Stack Depth by Thread chart
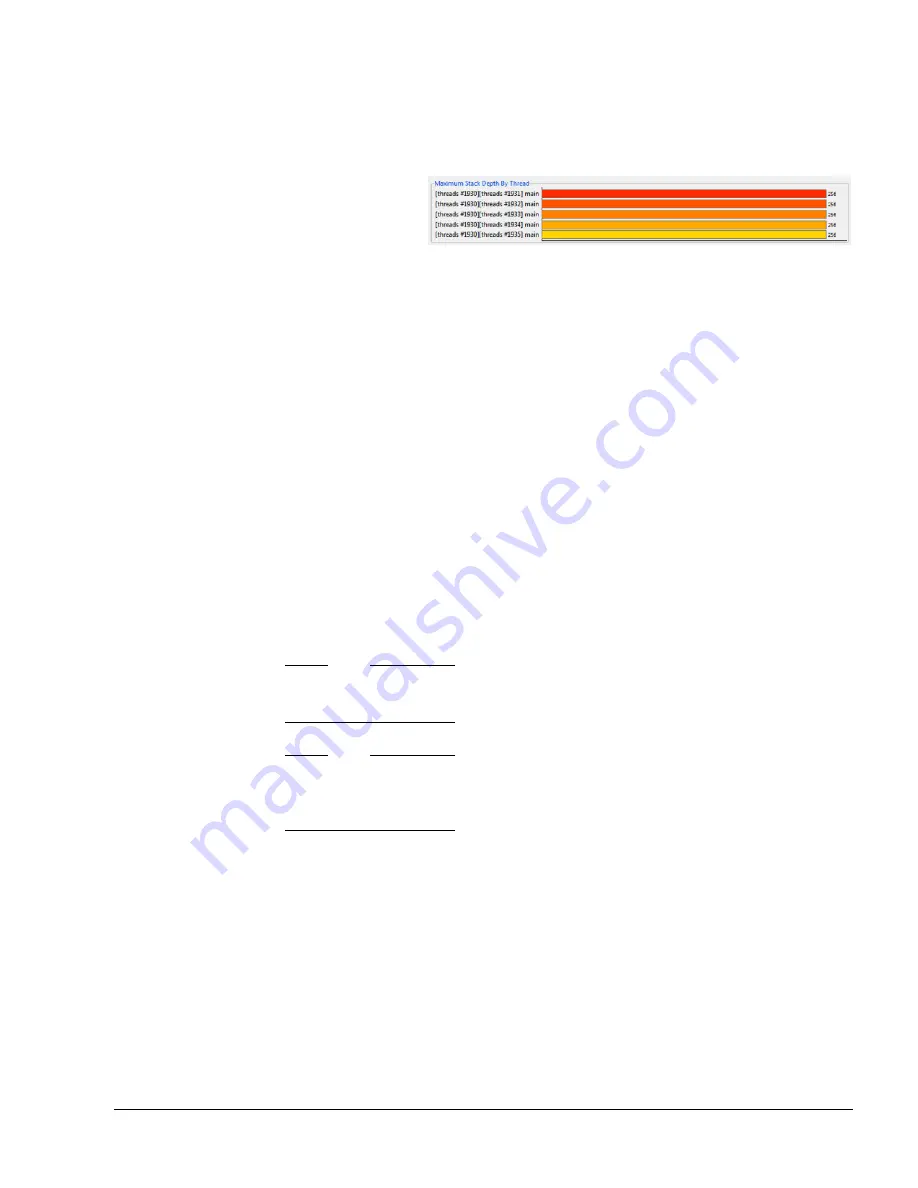
At the top of the Stack view is a chart that lists best candidate for stack optimization for each
thread.
Figure 7-2 Maximum Stack Depth by Thread chart
Beside each bar is the name of the process that called the function, then the thread, then finally
the function itself. This function exists in the call path with the highest stack depth for the thread,
and, out of all the functions that exist in this call path, it used the most bytes.
Clicking on one of the bars bar filters the stack view to feature only functions that contributed
to the peak stack for that thread. Click the
Show All
button to return the Stack view to its default
state.
Here is a list of all of the column headers available in the Stack view:
Stack
The number of bytes used by the stack in this function. A question mark appears
next to the total here if the function's stack usage is unknown. Try turning on Call
stack unwinding in the Capture Options dialog box for best results in this view.
Size
The total size of the function, in bytes.
Function Name
The name of the function, as specified in the source code.
Location
This column reports the location of the function, listing both the file name and
line of the declaration.
Note
The Stack view depends on successful call stack unwinding. For more information on setting
the
Call Stack Unwinding
option, see
.
Note
All data in the Stack view is dependent on the filtering selection in the Timeline view. If you
have used the caliper controls to filter data in the Timeline view, the data in the Stack view
reflects this selection.
7.5.1
See also
Reference
•
Filtering data and other Timeline view controls
•
Table views toolbar options, contextual menu options and keyboard shortcuts
•
Sorting data in the table reports
•
Call Paths view column headers
•
.


