The Timeline View
ARM DUI 0482K
Copyright © 2010-2012 ARM. All rights reserved.
6-3
ID120712
Non-Confidential
Yellow to red
Responsible for some percentage of total instructions during this bin. Red
indicates a higher percentage.
Note
The [idle] process is color-coded differently than the other processes in the Timeline view.
When the system is fully idle, it is bright blue. When it is partially idle it is a lighter shade of
blue, and when the system is fully active, it appears white.
In addition to the colored bins, the Processes sections contained colored dots that indicate that
something triggered the process to delay. The color of the dots displayed depends on the cause
of the delay:
Blue
CPU contention caused the delay. This can happen if they are too many processes
and not enough cores to handle them.
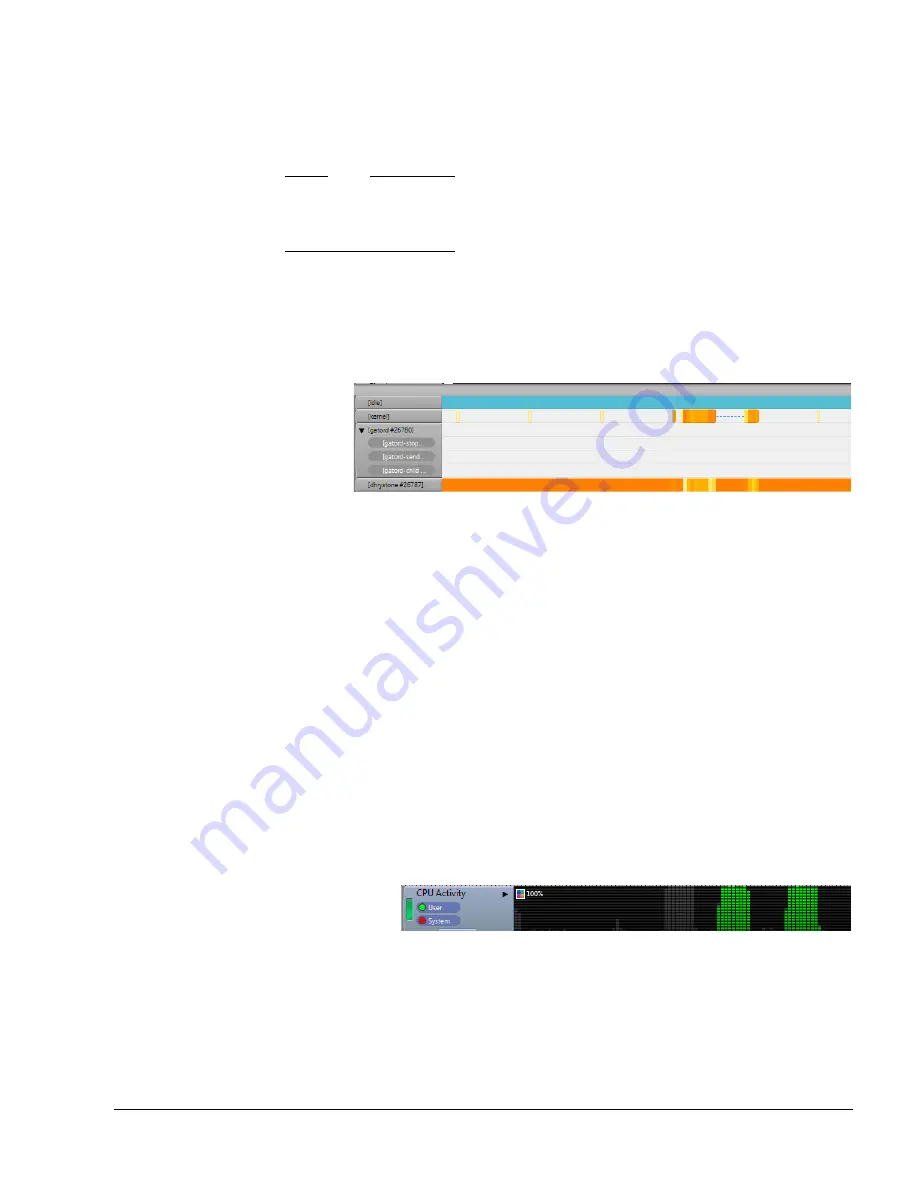
Figure 6-3 CPU contention dots in the Timeline view
Red
An I/O operation caused the delay. The process stopped while a read or a write to
disk occurred.
Green
A mutex triggered the delay.
If you select any number of processes or threads, all the charts in the Timeline view update to
reflect only activity caused by the selected processes and threads. All charts that do not contain
the necessary process information are blanked out.
Each of the multi-threaded or annotated processes in the list have a disclosure control. Use the
control to show each of the threads and annotations for that process. Annotations shown here
can be hierarchical, with annotation groups each containing a set of channels, as defined by the
macros inserted in your code. For more information on how to define annotation groups and
channels, see
Customize reports using Annotate
Unlike the other charts in the Timeline view, the current selection in the processes section affects
how the CPU Activity, CPU Wait, GPU Vertex, and GPU Fragments charts are displayed. When
there is an active selection in the processes section, the green bars change to reflect CPU activity
caused by the selected processes. Streamline still displays the total activity in dark gray so that
you can visually compare the selected processes CPU Activity values to the total.
Figure 6-4 A bar chart with an active selection in the processes section
GPU Vertex and Fragment bar charts display only activity initiated by the selected processes.
This allows you to differentiate between GPU activity caused by your application and activity
resulting from other applications or system services.


