The Timeline View
ARM DUI 0482K
Copyright © 2010-2012 ARM. All rights reserved.
6-2
ID120712
Non-Confidential
6.1
About the Timeline view
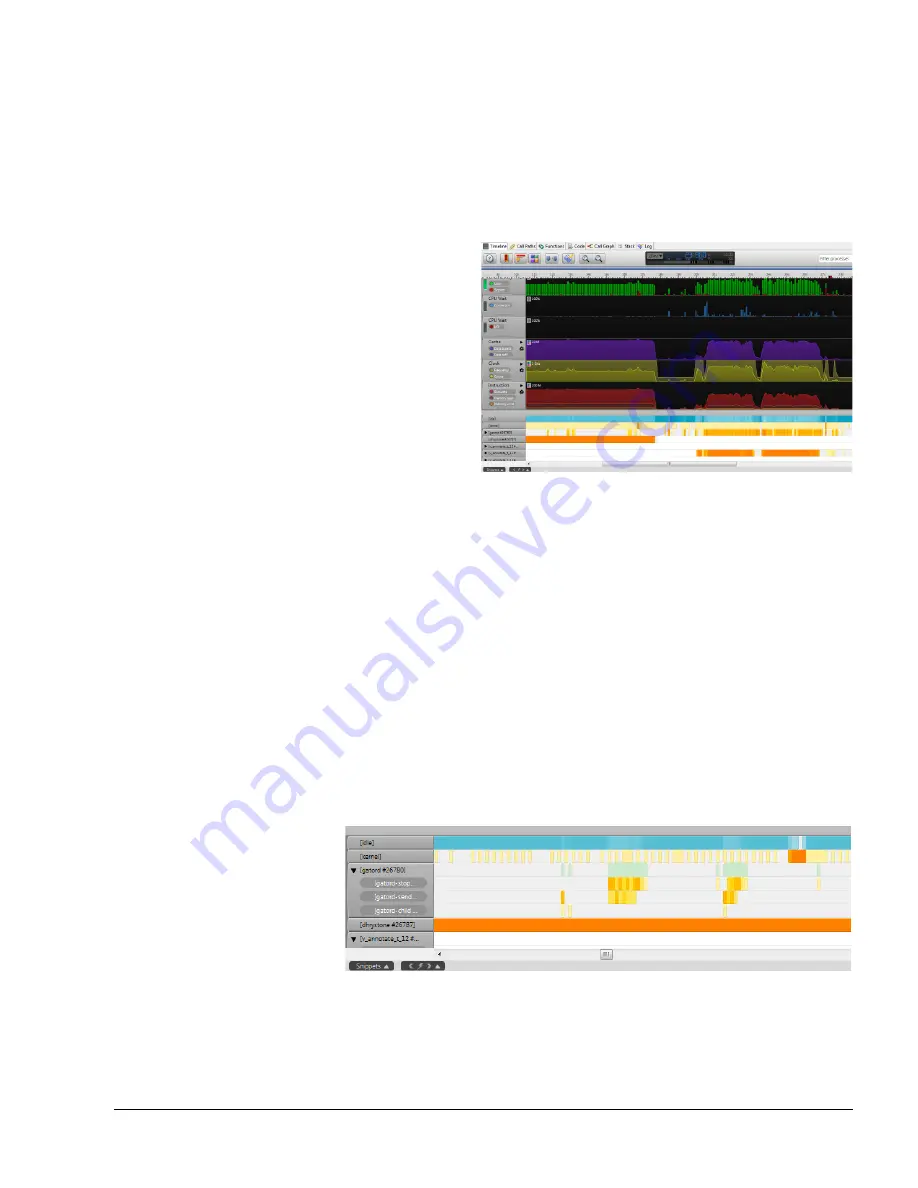
The Timeline view is the first view that you see when ARM Streamline opens a report. It
provides you with high level information about the performance of your target during the
capture session.
After you have successfully generated a report, Streamline opens it automatically and displays
the Timeline view.
Figure 6-1 The Timeline view
The Timeline view breaks up its data into bins, a unit of time defined by the unit drop down
menu at the top of the view. For example, if the unit is set to 100ms, every color-coded bin in
the processes section represents trace data captured during a 100ms window.
6.1.1
Charts
Streamline collects data for the charts from hardware and software performance counter
resources. The data is dependent on how you have configured your counters and the type of
system you use. For SMP systems, the chart disclosure control enables you to expand the data
to show collection either per core or per cluster.
6.1.2
Processes
The Processes section of the Timeline view shows you the active processes in each bin. The
entries are derived from process/thread trace data from the Linux kernel scheduler. Weighted
colors reflect the number of samples in each process or thread.
Figure 6-2 Process bars
White
Not running
Gray
The process has started, but is dormant. It could be sleeping, waiting on user
input, or waiting for some other process to finish.


