Configuring Counters
ARM DUI 0482K
Copyright © 2010-2012 ARM. All rights reserved.
5-4
ID120712
Non-Confidential
5.2
Using the Counters Configuration dialog box
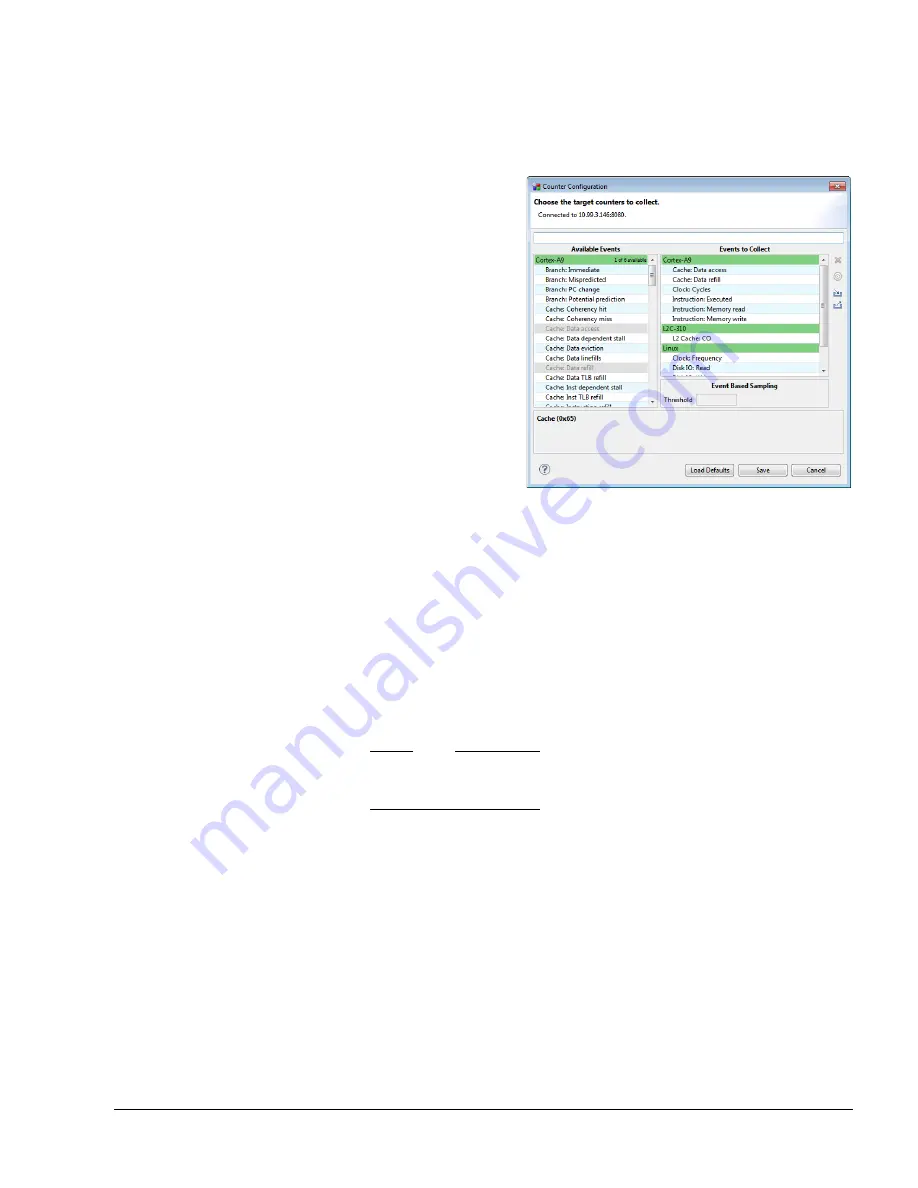
The Counter Configuration dialog box has a drag and drop interface to facilitate adding new
performance counters to your existing Events to Collect list.
Figure 5-3 The Counters Configuration dialog box
It contains the following two areas:
Available Events
The Available Events list contains categorized events offered for each core on
your current target as well as a list of OS-specific events. The events contained in
the processor lists depends on the type of processor as does the number of events
that you can add. Events that appear in gray are already in the Events to Collect
list. The maximum number of available events and the amount remaining are in
the upper right hand corner of the Available Events list. When you have reached
this maximum, all entries in the category list are grayed out and you cannot add
any additional events to the Events to Collect list.
Note
These available events that appear in this list are based on the PMU counters of
the core.
Events to Collect
This list of categories and events is what the Timeline view uses for its line
graphs. Each event listed here is available for display in the Timeline view using
the Chart Configuration view.
5.2.1
Adding new events
To add events to the Events to Collect list, select and drag them from the list of available events
and drop them in Events to Collect.


