The Timeline View
ARM DUI 0482K
Copyright © 2010-2012 ARM. All rights reserved.
6-10
ID120712
Non-Confidential
6.2
Timeline view charts
You can customize any of the charts in the Timeline view. Open the Configure Counters dialog
box to define which counters Streamline tracks and the Chart Configuration panel to define how
they appear. For more information on how to customize these charts, see
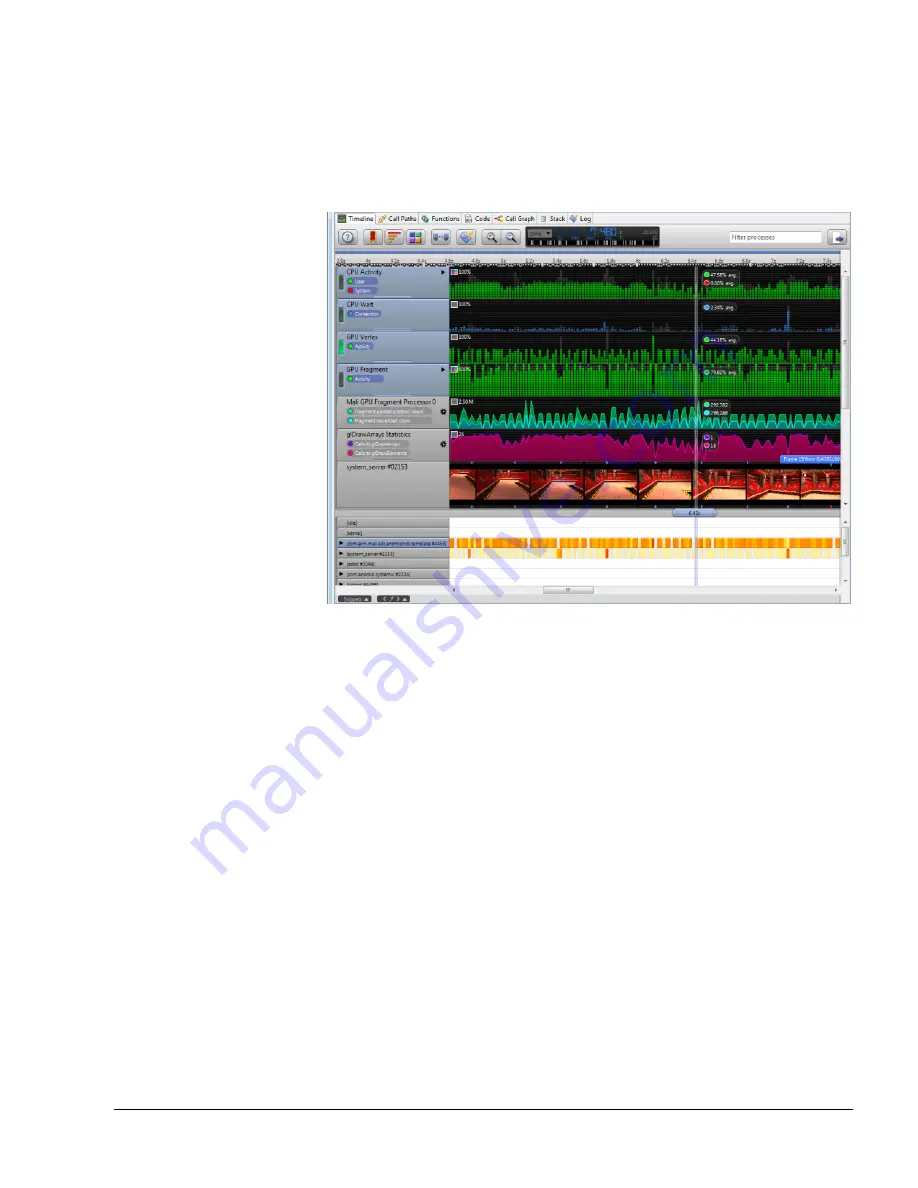
Figure 6-16 Mali charts in the Timeline
Here are some of the default charts in the Timeline view:
CPU Activity
The percentage of the CPU time spent in system or user code, the remainder being
idle time.
CPU Wait - Contention
Measures the amount of times the core was forced to wait due to contention as a
percentage. This is a binary indicator. When the task is waiting, this value is
100%, otherwise it is 0%. Use the tall, thin Process Focus button on the left side
of the CPU Wait-Contention chart handle to change the coloring of the processes
and show levels of contention. For more information on how to set up your Linux
kernel to provide CPU wait data, see
Setting up an ARM Linux target
CPU Wait - I/O
Measures how often waiting on I/O caused a task to stop running. This is also a
binary indicator. Like all of the CPU wait charts, you can use the Process Focus
button to view the processes by I/O wait.
CPU Wait - Mutex
Measures delays due to mutexes as percentage. When a task is stopped due to a
mutex, this value is 100%. As with the other Wait charts, the CPU Wait - Mutex
chart has a Process Focus button.
Clock
The number of cycles used by each core.


