The Timeline View
ARM DUI 0482K
Copyright © 2010-2012 ARM. All rights reserved.
6-13
ID120712
Non-Confidential
6.3
Customizing charts
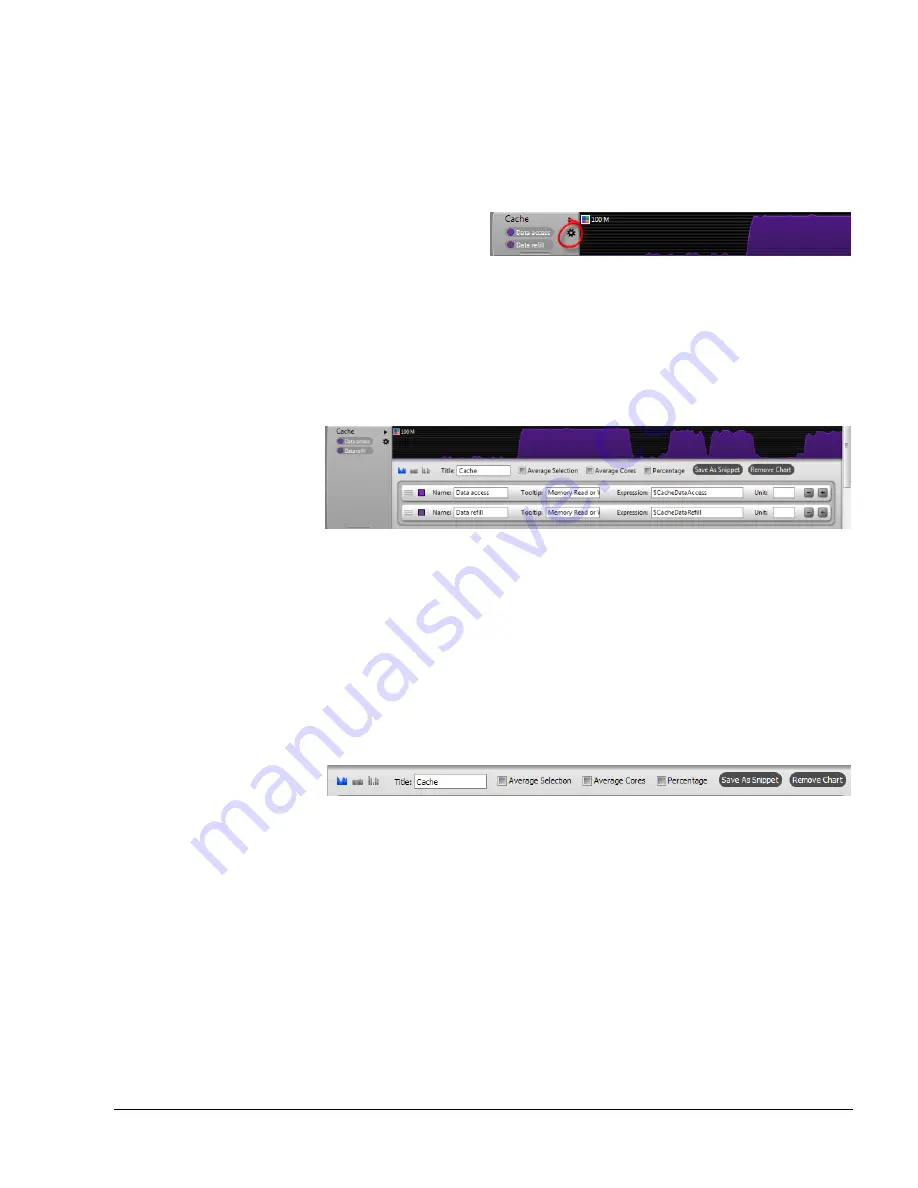
Many of the charts in the Timeline view have a button, located near the top right of the chart
handle, that opens a Chart Configuration panel. You can use this panel to change all aspects of
the chart from color to the data sets that the chart uses, giving you the option to display the data
you want in the manner you want it presented.
Figure 6-17 The Chart Configuration button
The Chart Configuration panel is broken down into two sections:
•
A toolbar section that contains controls that apply to the chart as a whole
•
A series section, which contains one or more series controls.
For example, the Cache chart contains two series,
Data access
and
Data refill
.
Figure 6-18 The Chart Configuration panel and Cache chart
The
Data access
series uses data from the
$CacheDataAccess
counter, while
Data refill
uses
$CacheDataRefill
.
In the toolbar, the Cache chart is defined as a
Stacked
chart, so the Timeline view draws it as
two stacked line graphs.
6.3.1
Chart Configuration toolbar options
Use the toolbar of the Chart Configuration panel to define chart options that apply to all series
in a chart.
Figure 6-19 The Chart Configuration panel toolbar
The toolbar of the Chart Configuration panel has the following options:
Type
Use the Type buttons on the left side of the toolbar to choose between one of the
following chart types:
Stacked
In a stacked style chart, filled line charts are stacked on top of each
other. The Timeline view stacks a filled line graph representing the
series at the top of the chart control on top of series that appear beneath
it. So the highest point of the graphs in a stack chart is an aggregate of
data from all of the series contained in the chart control. For example,
if the first value of series A is three and first value of series B is five,
the first data point in the stack chart that contains these series is eight.


