The Timeline View
ARM DUI 0482K
Copyright © 2010-2012 ARM. All rights reserved.
6-20
ID120712
Non-Confidential
6.4.2
Chart disclosure control
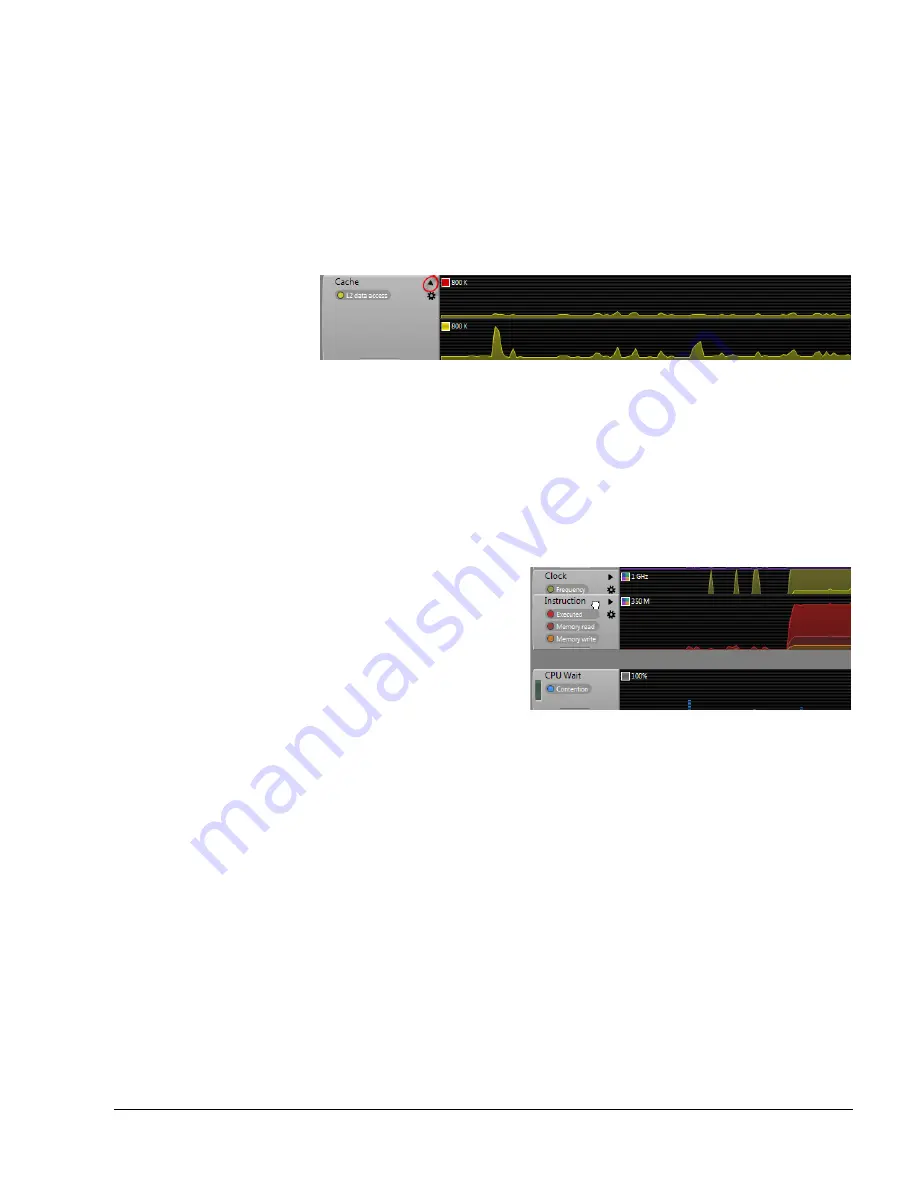
The chart disclosure control appears in the upper right in the chart handle of charts where per
core data is present. If you click on the disclosure control and there are no core clusters on your
target, the disclosure arrow points straight down and the chart expands to show a separate chart
for every core on your target.
If you do have clusters on your target hardware, the disclosure control behaves differently. Click
once and the arrow move down forty-five degrees and the Timeline view shows charts for each
cluster on your system.
Figure 6-29 Using the chart disclosure control to show per cluster data
Click the button a second time and the arrow moves straight down and the Timeline view shows
a chart for every core in your system. Click a third time and the chart returns to its default state.
6.4.3
Re-ordering charts and processes using the handle controls
Each chart and process has a rounded box on the left that contains the title, and in the case of
charts, a color-coded key. You can also use these rounded bars, called handles, to drag and drop
individual charts and processes into a preferred order.
Figure 6-30 Moving a chart using the handle control
To re-order a chart or process, click and drag the handle control, then release it where you want
it placed. To hide a chart, drag it to the bottom of the charts and drag the divider bar up until it
is hidden.
6.4.4
The Cross Section Marker
By default, the Cross Section Marker is inactive and the Cross Section Marker handle rests on
the far left of the divider bar. To move the Cross Section Marker, click anywhere in charts or
processes. The Cross Section Marker appears where you clicked and provides data specific to
the bin where you placed it.


