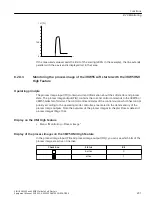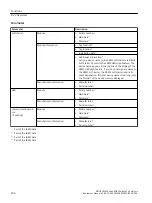
Measured values
Measured value
Description
Phase currents (%)
• I L1
• I L2
• I L3
• Average
• Show bar chart
1)
The phase currents are shown as a percentage relative to the rated op‐
erational current I
e
. You can monitor each phase (L1/L2/L3) individually,
or the average of all 3 phases.
These measured values can be presented graphically as a bar or line
chart on the display of the 3RW5 HMI High Feature.
1)
You will find further information in chapters Design and operator con‐
trols of the High Feature 3RW5 HMI (Page 98) and Graphical display of
measured values on the 3RW5 HMI High Feature (Page 229).
Phase currents (rms)
• I L1
• I L2
• I L3
• Average
• I L1/L2/L3 max
• Show bar chart
1)
The phase currents are displayed in amperes. You can monitor each
phase (L1/L2/L3) individually, the average of all 3 phases, or the maxi‐
mum value of each phase.
These measured values can be presented graphically as a bar or line
chart on the display of the 3RW5 HMI High Feature.
1)
You will find further information in chapters Design and operator con‐
trols of the High Feature 3RW5 HMI (Page 98) and Graphical display of
measured values on the 3RW5 HMI High Feature (Page 229).
Asymmetry
The maximum deviation as a percentage of one phase current relative to
the average value of all 3 phase currents.
Motor voltage
• U L1-L2
• U L2-L3
• U L3-L1
The motor voltage is shown in Volts. You can monitor the motor voltage
of each phase.
These measured values can be presented graphically as a line chart on
the display of the 3RW5 HMI High Feature.
1)
You will find further information in chapters Design and operator con‐
trols of the High Feature 3RW5 HMI (Page 98) and Graphical display of
measured values on the 3RW5 HMI High Feature (Page 229).
Power
Active power
Indicates the current active power in kW.
This measured value can be presented graphically as a line chart on the
display of the 3RW5 HMI High Feature.
1)
You will find further information in chapters Design and operator con‐
trols of the High Feature 3RW5 HMI (Page 98) and Graphical display of
measured values on the 3RW5 HMI High Feature (Page 229).
Power factor L1...3
Indicates the current power factor.
Line frequency
Indicates the current line frequency in Hz.
Output frequency
This value is displayed only if the starting and stopping output frequen‐
cies differ from the line frequency.
Motor temperature rise
Current value of motor temperature rise in %. This measured value is
calculated internally by the 3RW55 or 3RW55 Failsafe soft starter and
indicates the relative temperature rise of the motor.
Remaining time for motor overload protection
The remaining time for motor overload protection provides a dynamic
prediction of the time in seconds remaining until the tripping of the
motor overload protection, depending on the momentary motor cur‐
rent.
Remaining motor cooling time
The remaining recovery time in seconds after protective tripping of the
motor until the 3RW55 or 3RW55 Failsafe soft starter is ready to operate
again.
Functions
8.20 Monitoring
SIRIUS 3RW55 and 3RW55 Failsafe Soft Starters
228
Equipment Manual, 02/2022, A5E35630887002A/RS-AF/006

