
222
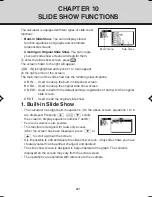
CHAPTER 10
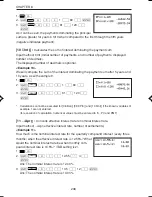
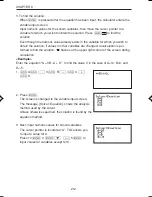
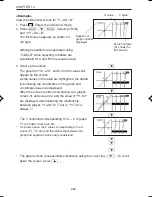
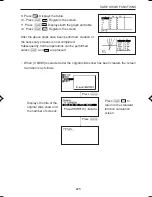
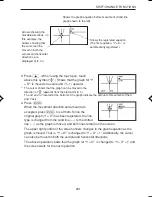
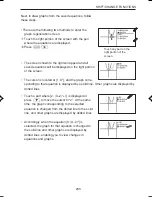
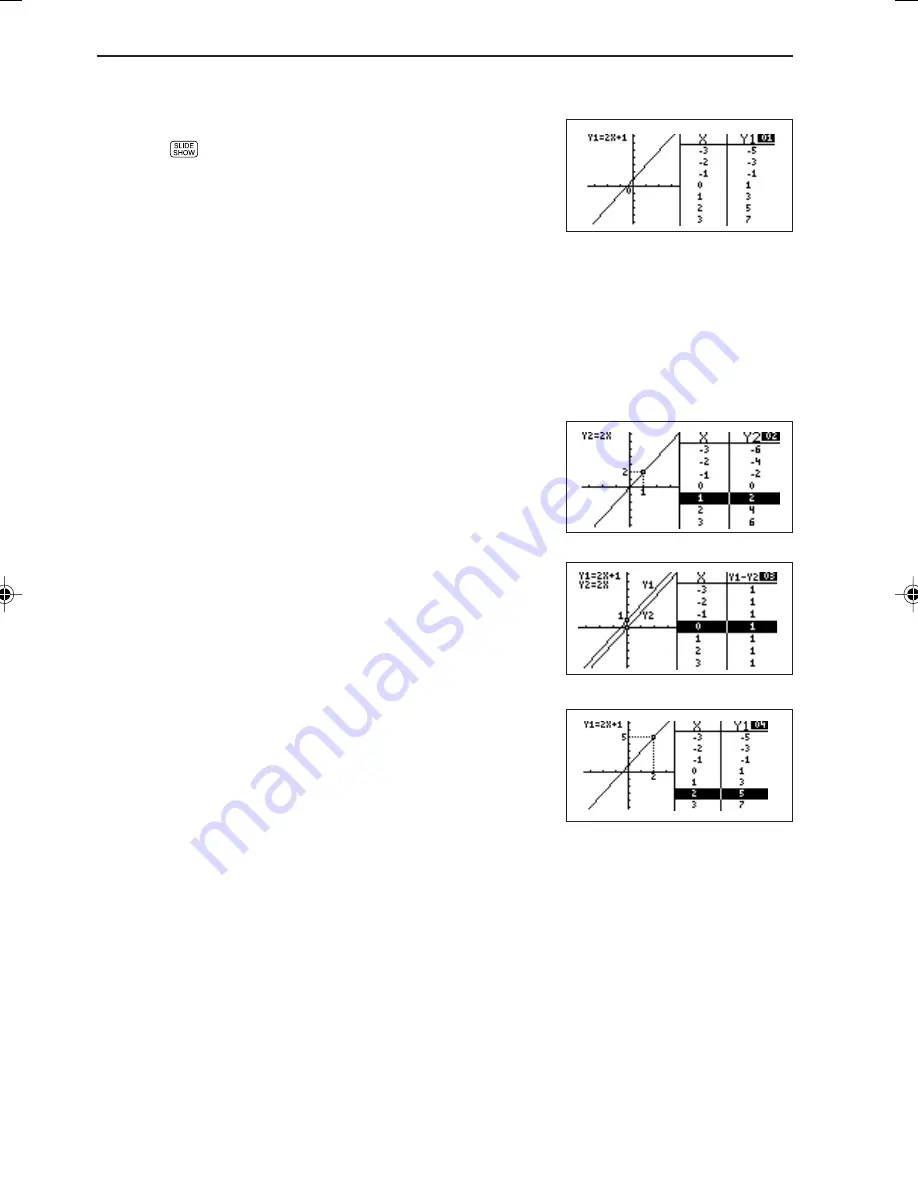
3. Scroll up the screen.
The graph for “Y2 = 2X”, and X and Y2 values will
appear on the screen.
As the values in the table are highlighted, the dotted
line showing the coordinates on the graph and
coordinate values are displayed.
When the screen is further scrolled up, two graphs,
screen 01 and screen 02, and the value of “Y1–Y2”
are displayed, demonstrating the relationship
between graphs Y1 and Y2. (That is, “Y1–Y2” is
always 1.)
≥
≥
≥
≥
≥
≥
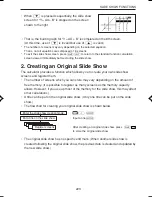
Equation of
graph currently
displayed
X value
Y value
Screen number
(01 shows the
first screen.)
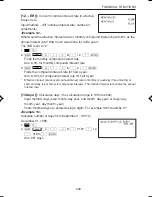
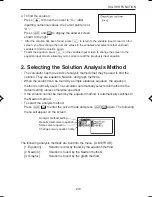
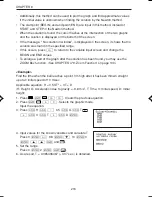
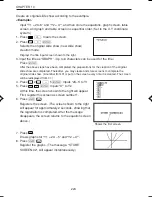
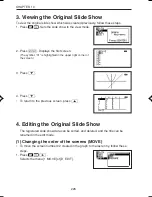
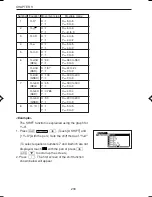
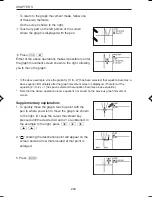
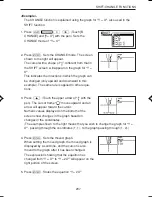
<Example>
View the slide show screen for “Y = AX + B”:
1. Press
. Enters the slide show mode.
2. Press
®
≥
®
. Selects [A B-IN]
and “2 Y = AX + B”.
The first screen appears as shown on
the right.
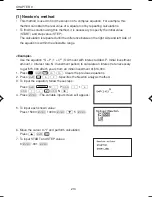
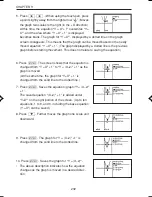
Although equations are expressed using
“Y=AX+B” when selecting, numbers are
substituted for A and B in the actual screen.
The Y coordinate corresponding to “X = 2” in graph
Y1 is shown on screen 04.
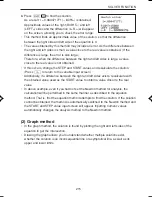
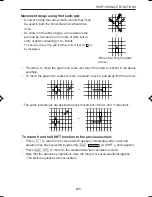
*
As shown above, the Y values corresponding to the X
values (Y1, Y2, etc.) and the relationship between the
graph and equation can be easily understood.
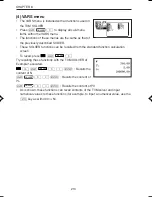
• The graph screen is sequentially scrolled up using the cursor key (
≥
). (To scroll
down the screen, press
≤
.)
...
←
←
←
←
EL-9650-(10)En (221-228)
8/3/00, 4:56 PM
222
Содержание EL-9650
Страница 10: ...viii ...
Страница 46: ...36 CHAPTER 1 ...
Страница 230: ...220 CHAPTER 9 ...
Страница 268: ...258 CHAPTER 12 ...
Страница 349: ...339 APPENDIX When coordinate system is Rect param or polar ...
Страница 350: ...340 APPENDIX When coordinate system is Seq F STYLE2 E STYLE1 ...
Страница 352: ...342 APPENDIX ...
Страница 353: ...343 APPENDIX on Program screen ...
Страница 354: ...344 APPENDIX ...
Страница 355: ...345 APPENDIX ...
Страница 356: ...346 APPENDIX ...
Страница 357: ...347 APPENDIX ...
Страница 358: ...348 APPENDIX ...