134
CHAPTER 4
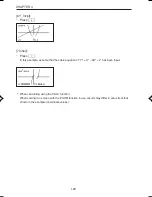
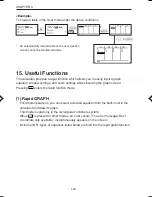
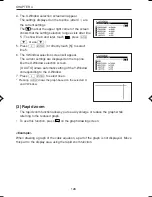
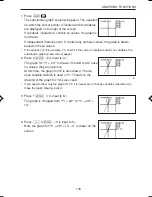
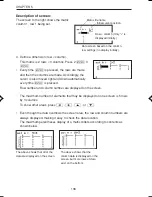
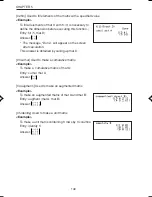
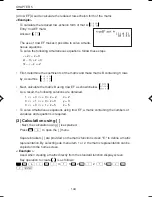
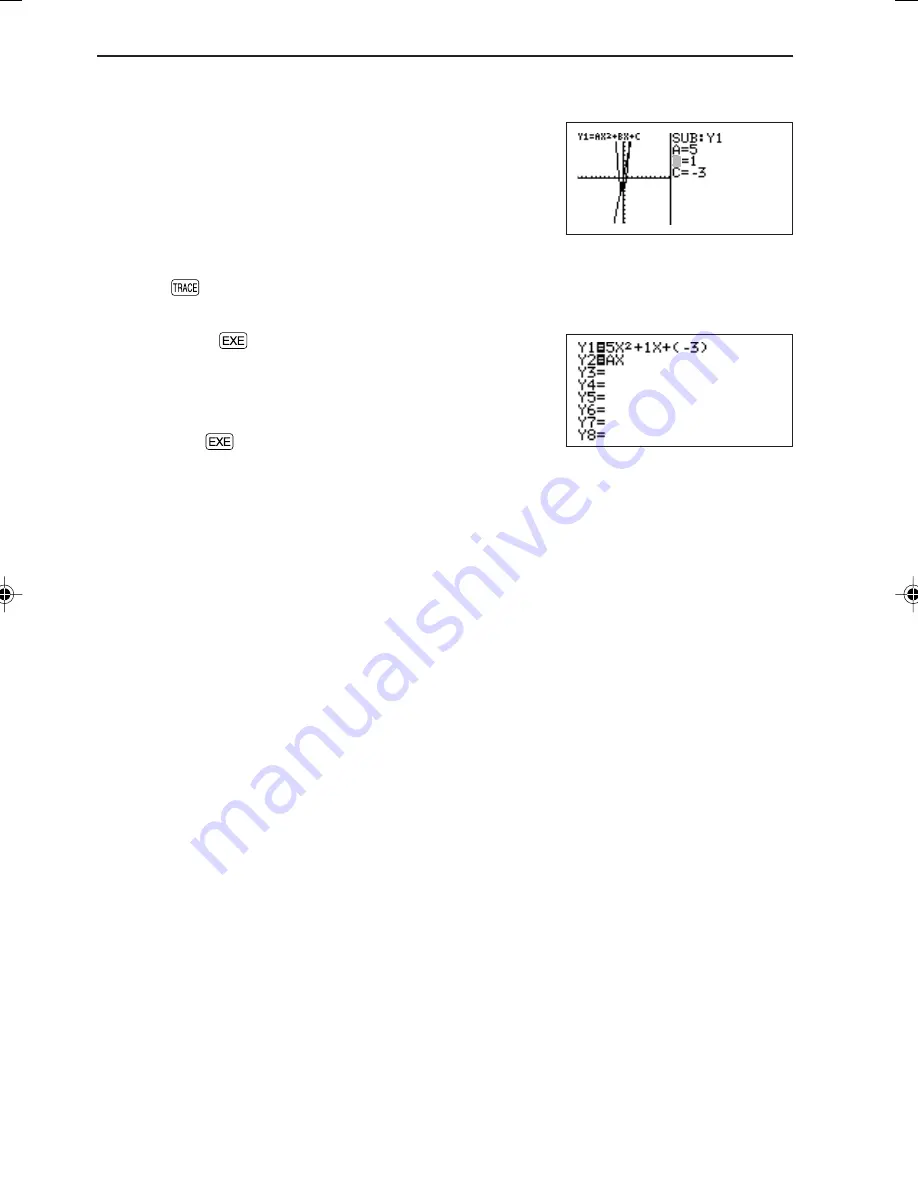
Next, change variable A from 2 to 5 and view how the graph changes.
1. Press
≤
≤
5
®
. (The cursor is moved from
C to A and 5 is input.)
The slope of the graph becomes sharp.
*
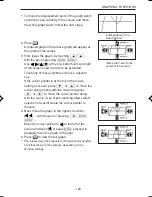
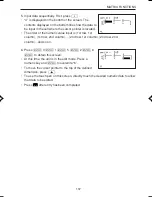
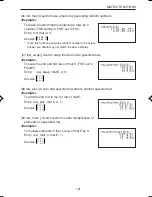
Accordingly, move the cursor and substitute other numeric
values for variables to view how the graph changes.
*
The trace function cannot be used in the substitution graph
mode.
(When
is pressed, the full-screen graph will appear.)
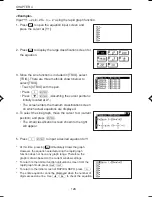
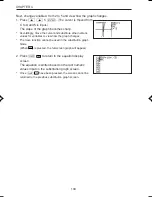
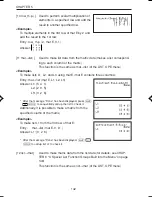
2. Press
Ï
to return to the equation display
screen.
The equation is written based on the last numeric
values input on the substitution graph screen.
*
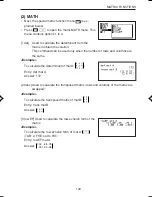
Once
Ï
have been pressed, the screen cannot be
returned to the previous substitution graph screen.
B
EL-9650-(04)En (079-134)
8/7/00, 9:08 PM
134
Содержание EL-9650
Страница 10: ...viii ...
Страница 46: ...36 CHAPTER 1 ...
Страница 230: ...220 CHAPTER 9 ...
Страница 268: ...258 CHAPTER 12 ...
Страница 349: ...339 APPENDIX When coordinate system is Rect param or polar ...
Страница 350: ...340 APPENDIX When coordinate system is Seq F STYLE2 E STYLE1 ...
Страница 352: ...342 APPENDIX ...
Страница 353: ...343 APPENDIX on Program screen ...
Страница 354: ...344 APPENDIX ...
Страница 355: ...345 APPENDIX ...
Страница 356: ...346 APPENDIX ...
Страница 357: ...347 APPENDIX ...
Страница 358: ...348 APPENDIX ...