INSTRUCTION, USE AND
MAINTENANCE MANUAL
EN
Page 35 of 77
- The following screen page will appear on the monitor:
Fig. 55
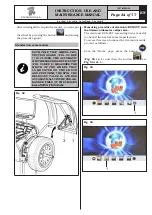
- Place the distance-diameter caliper grippers (
Fig. 56
ref. 1
) in contact with the rim.
1
Fig. 56
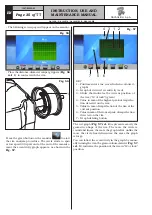
Press the green button on the monitor
to start
the rim analysis procedure. The circle starts to spin
at low speed (30 rpm) and at the end of the measure-
ment the eccentricity graph appears, as shown in the
Fig.
_
57
.
Fig. 57
1 2
3
6
KEY
1 – Fundamental sine wave(fuchsia-coloured-
graph)
2 – Graph of detected eccentricity (red)
3 – Slider that indicates the current position of
the rim ("12 o'clock") (green)
4 – Value in mm of the highest peak of imperfec-
tion detected on the rim
5 – Value in mm of imperfection of the rim at the
current position
6 – Value in mm of the lowest peak of imperfection
detected on the rim
7 – Graph deleting button
4
5
7
The red graph (
Fig. 57 ref. 2
) represents exactly the
geometric shape of the rim. The more the circle is
round and linear, the more the graph is flat, unlike the
more the circle has deficiencies, the more the graph
is large.
You can follow the eccentricity in the graph by manu-
ally turning the rim, the green-coloured-slider (
Fig. 57
ref. 3
), indicates the position of the rim in "12 o'clock"
position.
1297-M005-03
RAVAGLIOLI S.p.A.
G4.140R - G4.140WS - G4.140WSLB - GP4.140WS


