


Tel: (888) 545-1254 • Fax: (415) 358-4602 • Email: [email protected]
www.PrecisionRatedOptics.com
35
7.1 OTDR Quick Test
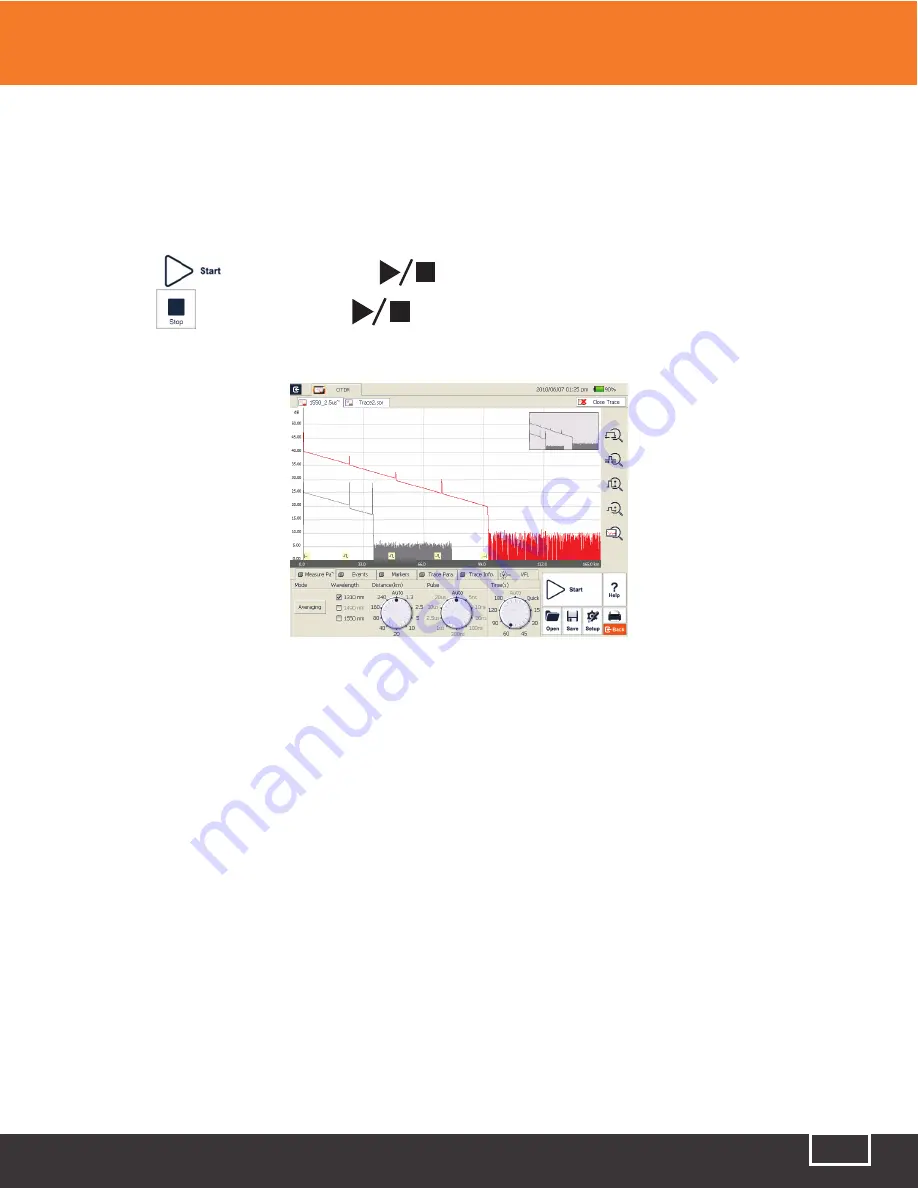
7.1.1 Check the connection between the fiber and the OTDR optical port, making sure they are properly
connected.
7.1.2 Click the
icon, or press the
button to start testing.
7.1.3 Click the
icon, or press the
button to stop testing.
Fig 7.1 Shows the interface after a trace acquisition:
Note:
●
During testing, the averaging trace shows in the trace display area and refreshes at certain intervals.
The trace result are displayed immediately following the final trace.
●
The user can stop tracing at any time. If stopped, the application will display all trace information
gathered up to that point.
●
After a trace analysis is complete (or manually stopped by the user) the system will perform
automatic trace analysis. The analysis usually takes about 5 seconds or less, after which the user
can initiate a new trace.
●
In Averaging Mode, the interface will display the remaining time of the trace.
●
In “Real-Time” mode, the trace will keep going until the user manually stops it.
7.2 Trace Processing
After tracing and automatic analysis is complete, the event types will be displayed below the trace area.
The user can review all of the events’ information in the events list, which can be viewed through the
{Events} tab. The user can also save traces, open saved traces to review, or initiate a new trace.
Note:
The application will prompt the user to save unsaved traces before initiating a new trace.
7 Testing with the OTDR
Fig 7.1 OTDR Trace Acquisition Interface
Содержание TP-P6
Страница 1: ...TP P6 Manual Multifunctional Test Platform...