Graphic Operation Terminal F940GOT
Creation of Display Screens (FX-PCS-DU/WIN-E) 10
10-34
u
u
u
u
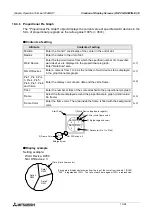
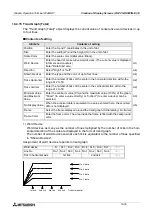
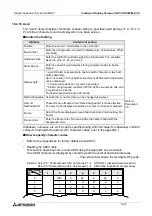
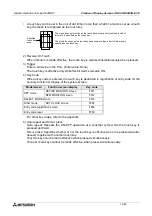
Display example
•
The word devices D100 to D103 are sampled every 3 seconds, and trend graphs are dis-
played.
•
Numerics 0 to 9 in the scale are created using the "Text" object.
•
If the data acquired by sampling is smaller than the minimum value or larger than the maxi-
mum value, it is not displayed in the graph and the graph is discontinued.
•
When the line type is set to "None", the graph is not displayed on the screen.
"Trend Graph (Sample)" object
6
5
4
3
2
1
0
6
1
2
3
4
5
7
8
9
No. 3 (D102)
When the acquired data is smaller
than the minimum value
(or larger than the maximum value)
No.1 (D100)
"Text" object
Word Device
Sampl. Cycle
Ticks Horizontal
Ticks Vertical
Minimum Value
Maximum Value
Shown Device: No. 1
Device: No. 1
Device: No. 1
Device: No. 1
Scale Color:Black
D100
3
10
7
0
1000
Solid Red
None
Dotted Blue
None
Содержание F940GOT-LWD-E
Страница 1: ...OPERATION MANUAL F940GOT SWD E F940GOT LWD E...
Страница 4: ...Graphic Operation Terminal F940GOT 2...
Страница 6: ...Graphic Operation Terminal F940GOT 4...
Страница 8: ...Graphic Operation Terminal F940GOT 6...
Страница 14: ...Graphic Operation Terminal F940GOT Contents vi...
Страница 104: ...Graphic Operation Terminal F940GOT Alarm Mode 6 6 12...
Страница 148: ...Graphic Operation Terminal F940GOT Creation of Display Screens 9 9 30...
Страница 228: ...Graphic Operation Terminal F940GOT Changeover of Display Screen FX PCS DU WIN E 11 11 18...
Страница 298: ...Graphic Operation Terminal F940GOT D 6...

