Z-Trak2 3D Profiler Sensors
Using Z-Expert
•
49
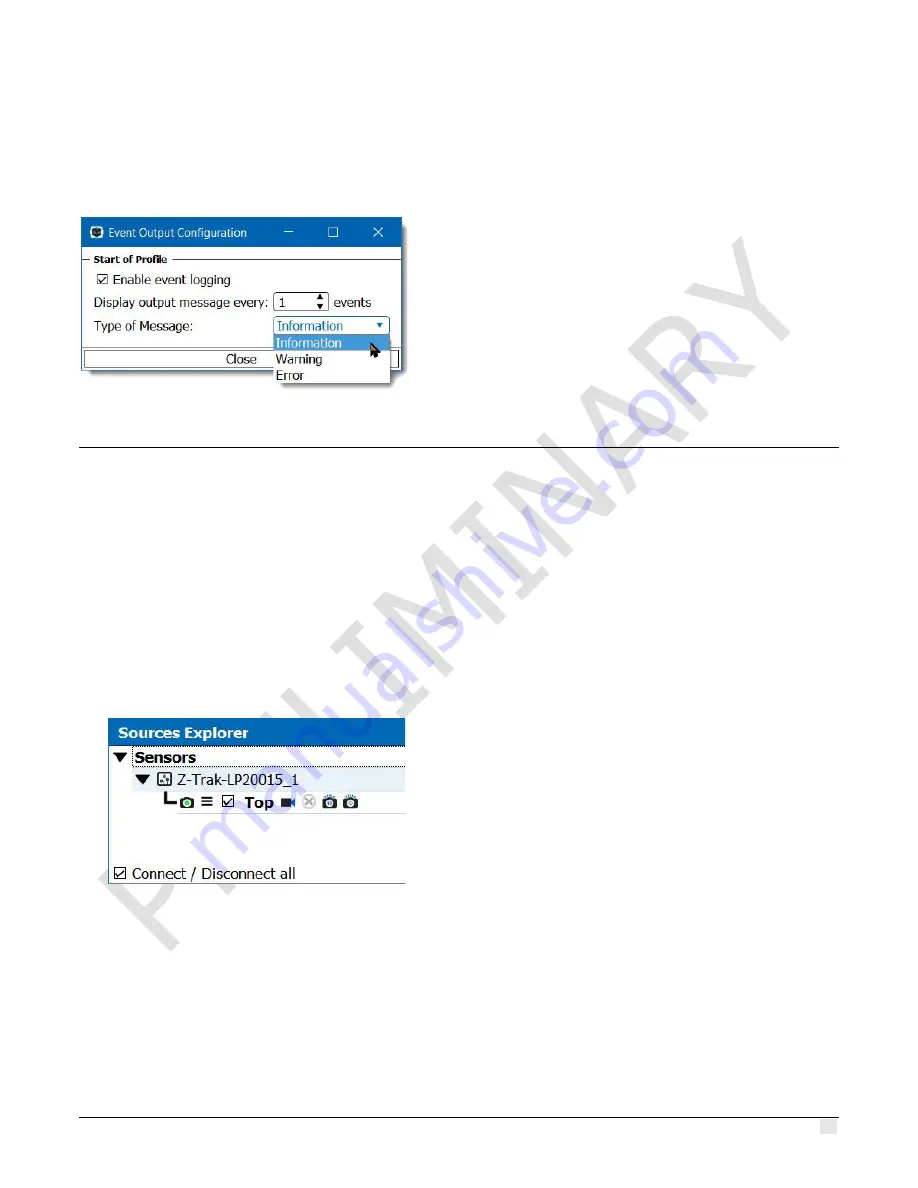
To alert users on potential issues, event occurrences can be displayed in the Console Messages
pane. Open the event's shortcut menu and select
Log Event
. In the
Event Output Configuration
dialog, click
Enable event logging
. Modify the other settings as desired. From then on, the
sensor, name of the event, count and timestamp will be displayed in the console at the specified
rate. An event qualified as
Error
will be shown in red, a
Warning
in yellow.
Setting Acquisition parameters
Below are examples of settings you can use to test your Z-Trak2 laser profiler with Z-Expert. Make
sure the
Features Browser
is open.
Acquiring a profile
How to acquire a single profile
1.
From the Z-Expert
Sources Explorer
, select one or more detected sensors.
2.
In the
Data Output
category of the
Features Browser
, set
Profiles per Scan
to
1
.
3.
In the
Format
subcategory:
i.
Set
Device Output Type
to
Linescan3D
.
ii.
Set
3D Data Type
to
UniformX Z
.
iii.
Set
Measurement Units
to
Micrometer
.
4.
In the
Profile Intensity
category:
i.
Set
Laser Safety
to
Internal
(if permitted by local regulations).


