


en04d141.fm, 11.03.2008
PL12EN-1300 2008-03
97
Statistics
4
4
Statistics
4.1
Understanding Statistics
Your unit provides a wide array of statistical and data reports (charts) for the control of manufac-
turing processes. The following provides a description of the control chart for variables and an
outline of the procedure for its use. Known as the -R chart (pronounced X-bar-R), the chart for
variables can be used whenever a quality characteristic can be measured and expressed by a
numerical value. When properly used, it can bring substantial improvement in product quality and
a reduction of scrap and rework.
When we control a process, we monitor the variation of the characteristics that are important to
the product. During production, samples from the process are measured. By plotting the results
of these measurements on the control chart, we are able to see if the process is operating in a
stable manner (in a state of statistical control), or if the pattern has been disturbed by an event
that drives the process out of control. In other words, the control chart tells us what the process is
doing - when to take action and when to leave it alone.
Although it is a powerful tool, the -R Control Chart is easy to use. Only an understanding of a
few basic statistical concepts and the use of simple arithmetic is needed.
4.1.1
The Nature of Variation
Variations in measured product are always present because of random fluctuations and inconsis-
tencies in machines, material, and operator performance. No two items produced are exactly
alike.
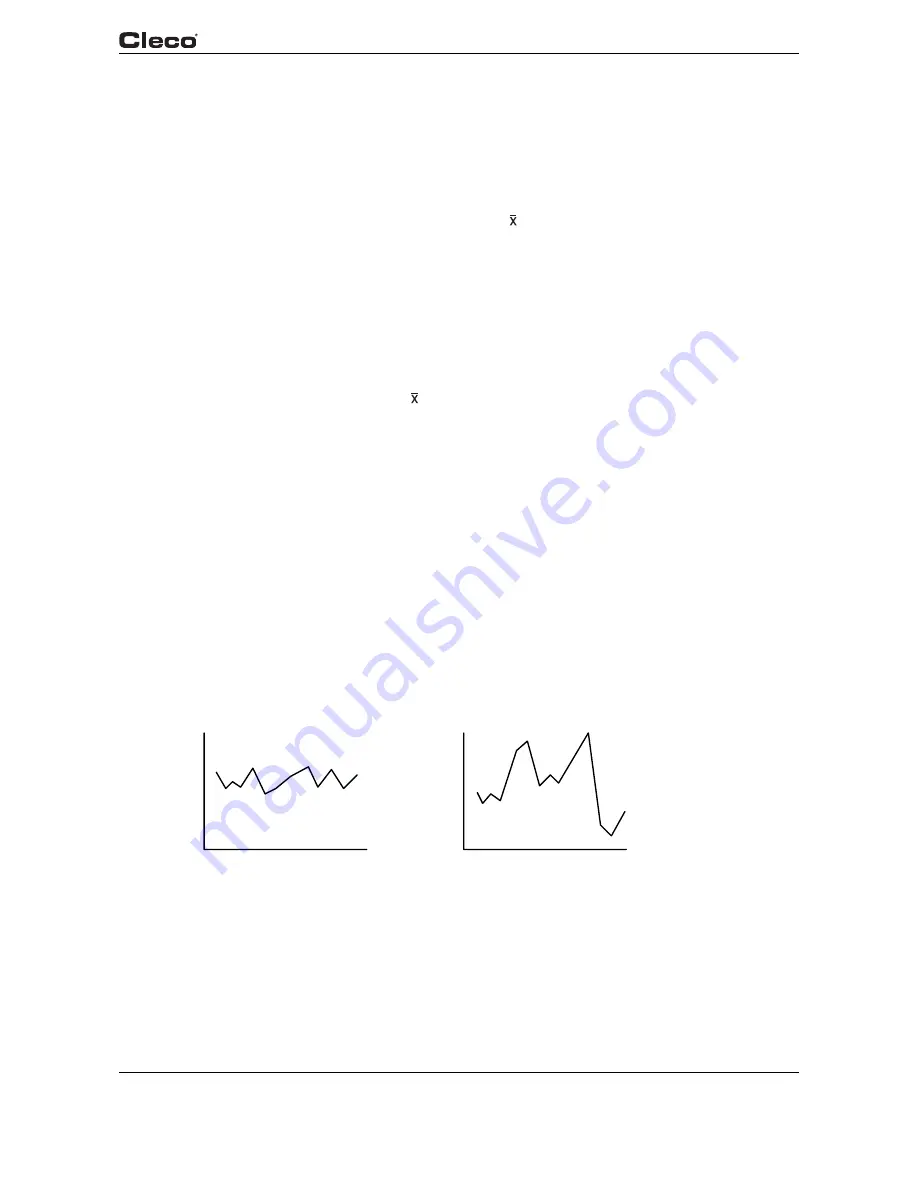
When variation is random and stable, the process is in a state of statistical control (see graph
4-1a). The process has an identity, and its performance is predictable. The stable pattern of vari-
ation is caused by conditions that are inherent to the manufacturing system, such as spindle run
out, bearing clearances, differences in material properties, accuracy of measuring equipment,
and operator performance. We call this "common cause" variation.
When variation is sporadic and unstable, the process is out of statistical control (see graph
4-1b). The process loses its identity and is no longer predictable. The unstable pattern is caused
by such events as tool breakage, tool wear, bad material, and operator error. This is called "spe-
cial cause" variation.
Fig. 4-1: a) Common Cause Variation Fig. 4-1: b) Special Cause Variation