


en04d141.fm, 11.03.2008
PL12EN-1300 2008-03
101
Statistics
4
Sometimes a process takes time to stabilize after start-up. If the indication of special cause vari-
ation occurs only in the first few samples, continue to take several more samples and recalculate
the limits by omitting the special cause values. However, if the indications of special cause varia-
tion occur other than at start-up, action should be taken to identify and correct the cause, and the
process re-started.
10. Evaluate for Process Capability
When the process is in a state of statistical control, estimate the standard deviation (
σ
) using the
value for the average range ( ) previously calculated.
(The factor is for samples of five units
only.)
2.326
=
R
Estimate of
σ
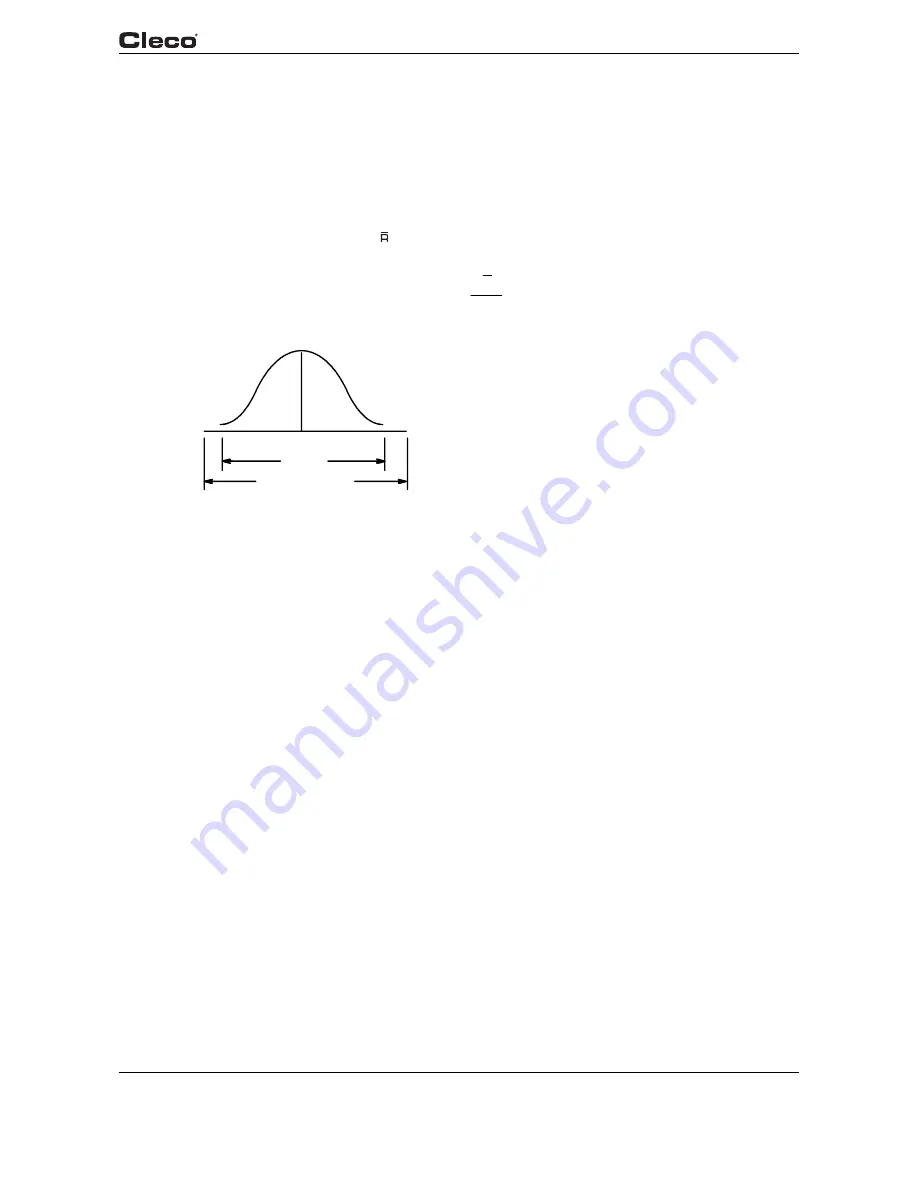
If the 6
σ
spread is equal to or less than the total specifica-
tion tolerance, the process is capable. It will produce at
least 99.7% of all items to specification.
Avg.
6
σ
Spec. Tolerance
Fig. 4-5: Capable Process
If the 6
σ
spread is greater than the specification tolerance, three options are available:
• Improve the system - reduce variability
• Increase the specification tolerance
• Continue production and sort by 100% inspection
11. Center the Process
After the 6
σ
capability requirement is satisfied, it may be desirable to center the process so that
the process average is close to the middle of the specification tolerance. This can usually be
accomplished by a simple machine or tooling adjustment. If the magnitude of the adjustment is
known, the center line and the control limit lines for the average plotting may be moved a dis-
tance equal to the adjustment, and re-verified after 20 additional samples are plotted. Centering
the process does not affect the center line or control limits for the range, so no adjustment should
be made to them.
12. Realign the Inspection Activity
When properly controlled, production can usually continue without the need for 100% inspection.
More attention can be placed on process surveillance and audits of operator performance. How-
ever, certain safety critical requirements will justify an independent verification.
13. Maintain Control
The operator shall continue to take sample measurements and plot the results on the control
chart. As long as the pattern of variation remains random and within the control limits, no action
is taken. However, if an indication of special cause variation is detected, the trouble should be
identified and corrected
(see graph 4-6)
. An indication of special cause variation can result from
conditions such as tool wear, tool breakage, defective material, measurement error, a mistake in
calculating the average or range for a sample, and plotting a point on the control chart incorrectly.