


100
PL12EN-1300 2008-03
en04d141.fm, 11.03.2008
Statistics
4
7.
Calculate Process Center Lines
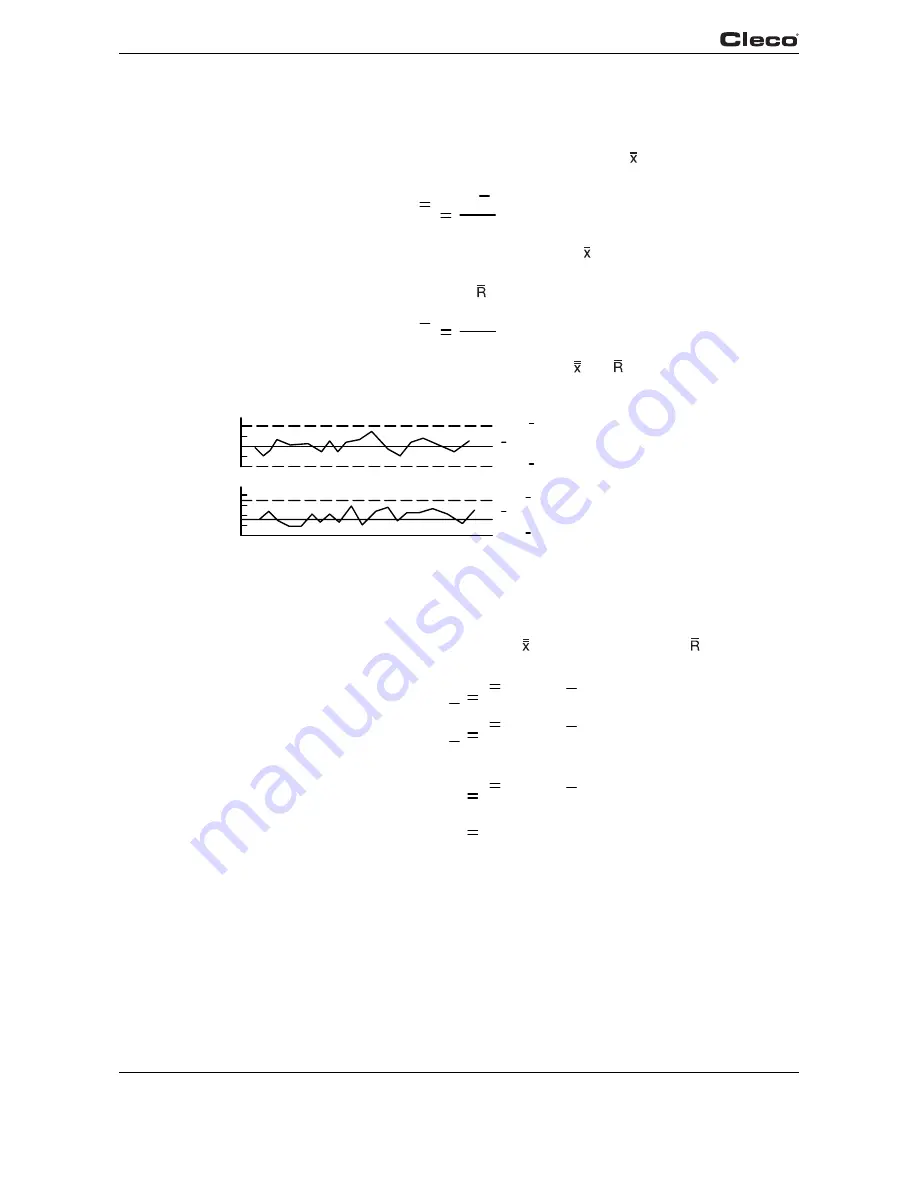
After data for 20 samples of five have been plotted, calculate the center lines for both the aver-
age and range plottings.
The center line for the average chart is known as the grand average ( ) and is the average of all
of the sample averages. This is the value that best represents the size of all measurements:
X
X
n
Σ
where
Σ
is used to indicate the sum of the sample averages, ( ),
(be careful to observe the
+ and - signs)
, and n the number of samples, in this case 20.
Similarly, the center line for the range chart ( ) is the average of the ranges for all samples.
R
R
n
Σ
Draw solid lines on the control chart for values representing and (see graph 4-4).
R
0
4
8
12
16
20
X
R
X
UCL
X
LCL
UCL
R
LCL
R
ange
A
ve
ra
ge
Fig. 4-4: Drawing The Center Lines And Control Limits
8.
Calculate Control Limits
Calculate the upper and lower control limits (UCL and LCL) using the following formulas and the
values previously calculated for the grand average ( ) and the average range ( ).
(Factors are
for samples of five units only.)
X
x
UCL
+0.577(R)
X
x
LCL
0.577(R)
X
R
UCL
+2.1
14(R)
0
R
LCL
Average
Range
Note: For a sample size of six or less, the lower control limit for the range is zero.
Plot the limits on the control chart as broken lines.
9.
Evaluate for Statistical Control
Analyze the control chart to see if the process is in a state of statistical control. Variation should
be random about the center lines for both averages and ranges, with all points within the control
limits. If these conditions are not satisfied, special cause variation may be present.