


Section 4 - MultiLogger Configuration
64
MLGPS-P
User's Guide
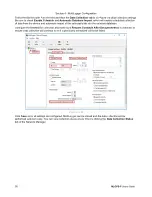
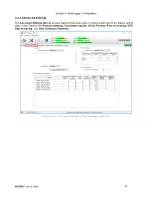
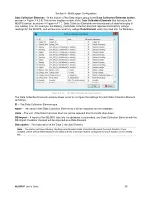
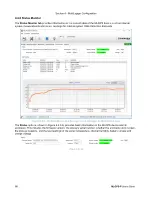
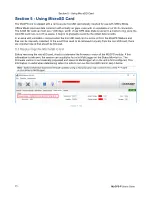
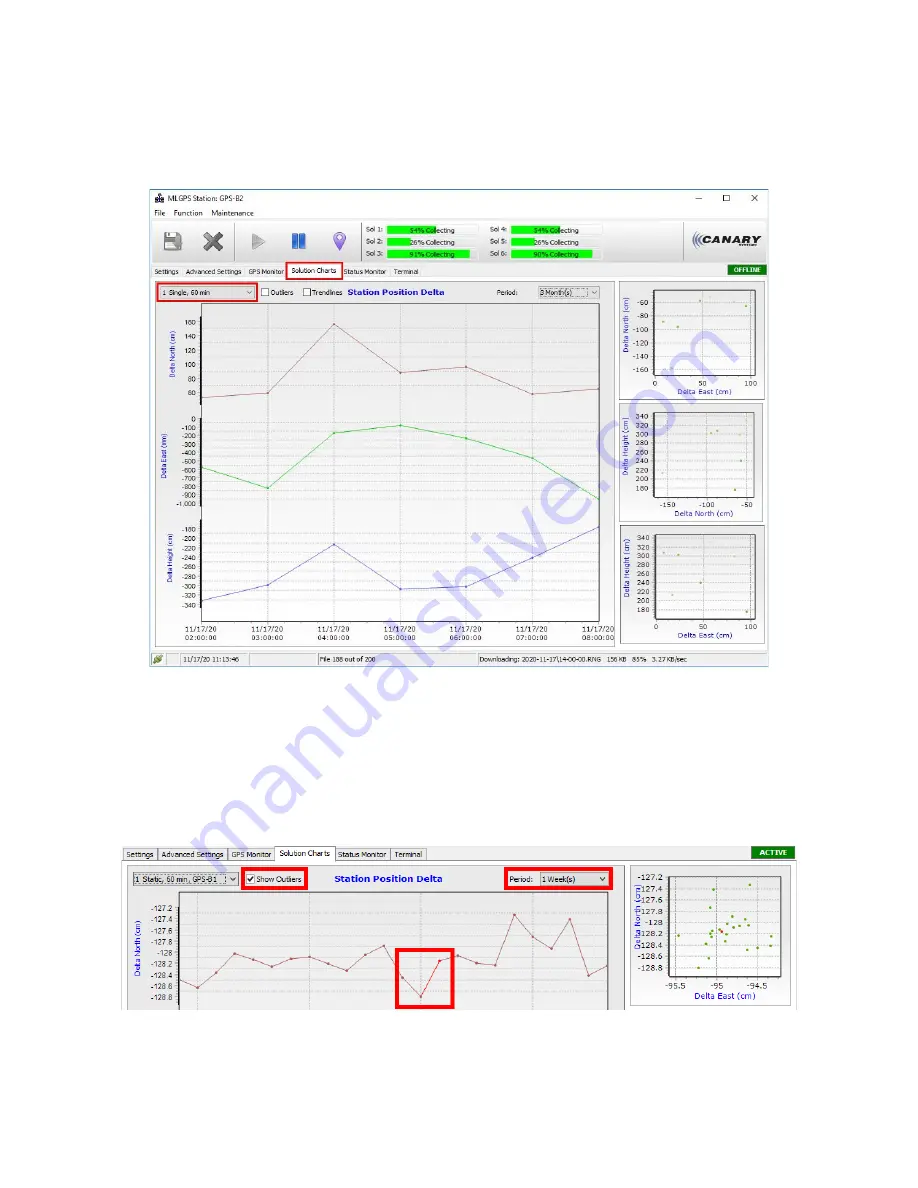
4.4.5 Solution Charts
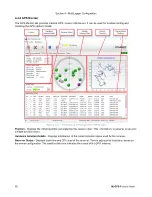
The solution charts of the
Solution Charts tab
display post-processed data stored in cache. These charts
show displacement relative to the initial Rover position. The solution being plotted can be selected from the
drop-down highlighted in Figure 4.4.5 A:
(Figure 4.4.5 A ‒ The Solution Charts tab of the Logger form of MultiLogger, for visualizing solution results)
The main line chart is divided into three parts:
Delta North
,
Delta East
, and
Delta Height
. To the right of the
line chart are three small scatter plots, that show 3D movement in different projections. The line chart is
synchronized with the scatter plots - if the line chart zoomed or panned, the scatter plots are automatically
updated.
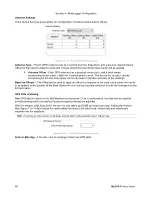
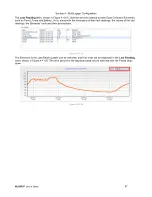
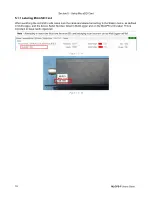
Period
- Changes the time period of the data displayed in the window.
Show Outliers
- Check to toggle the visibility of outliers on the chart, which are shown in red, as seen in Figure
4.4.5 B:
(Figure 4.4.5 B)