The following measurements are displayed in the Signal Level View Table. Results are updated every second while level tracking
is running.
Time:
Time in HH:MM:SS format when the measurement was taken
Location:
Optionally it includes a location label, if Location Label is enabled in the Setup menu (refer to
Signal Level:
The Signal level in dBm is measured every second for the SSID under test
Noise Level:
The Noise level in dBm is measured every second on the channel
SNR
: Signal to Noise Ratio for the SSID measured in dB measured every second
Test parameters displayed at the top of the table are identical to those from Graph measurements view. Refer to
for more details on these measurements.
7.5 Channel View
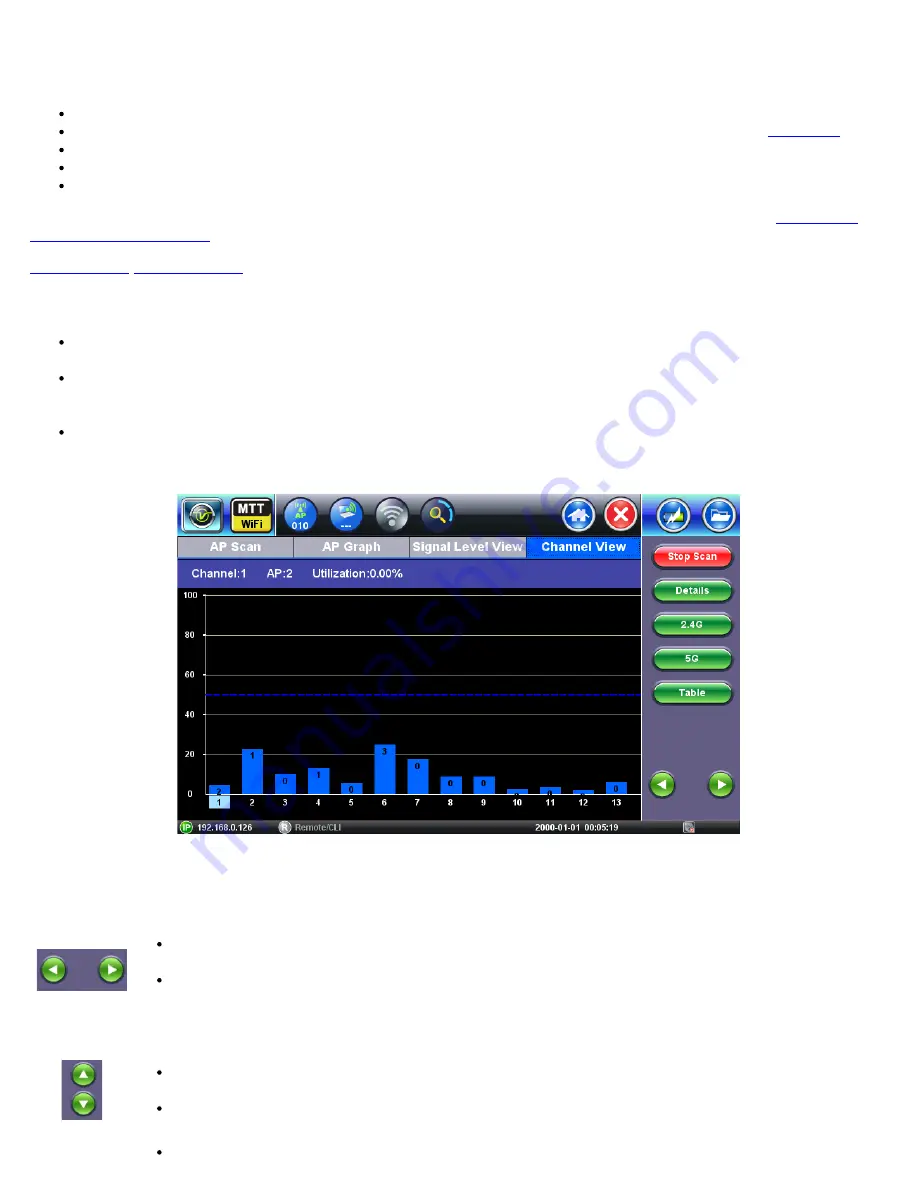
Channel View graph and table display the 2.4 GHz and 5 GHz frequency band channels utilization. Results are updated
while the network scan is running.
Channel
Utilization
measures the percentage of time that the RF channel is detected as “busy” and that the radio could
not initiate communication due to RF interference. The channel can be detected as “busy” because of WiFi transmissions
by APs on the channel or non-WiFi interference on the same frequency as the channel under test.
Results are updated every second.
Channel View Graph
7.5.1 Channel View Navigation
Channel View Graph Navigation
Use the Left and Right arrow keys to scroll through channels in the 2.4 GHz and 5 GHz frequency
band or tap on the channel.
The channel currently selected is highlighted in light blue. In the image above, Channel 1 is
selected.
Channel View Table Navigation
Use the Up and Down arrow keys to scroll through channels in the 2.4 GHz and 5 GHz frequency
band or tap on the row.
The channel currently selected is highlighted in blue.
Use the Page Up and Page Down arrow keys to move to the next page in the 2.4 GHz and 5 GHz
WiFiAirExpertSeries_eManual_D07-00-120P_Rev A00


