User Interface DF-760E
55
time, the AutoZero is automatically aborted and the Fail Zero flag is set in the Zero Cal
Log as shown in Figure 38.
The system provides warning of a scheduled AutoZero (preceded by a pre-zero purge if
any) before the calibration takes place, according to the time set in the
Pre-Zero Warning
.
The
Pre-Zero purifier purge
enables the user to set an amount of time from 1 to 200
hours during which the system will be purged with zero gas before the AutoZero process
begins. This is useful for gases such as oxygen that take a long time to equilibrate. When a
non-zero number is entered in this field, a separate purge count down is added to the auto
zero screen and this time is also automatically added to the timeout.
The
Zero Acceptance Criterion
allows the user to select the stability criteria required
before the zero value is accepted. The Stable selection (recommended) ensures the most
accurate zero calibration but takes the longest time to execute (68 minute delay before the
zero process begins). The Quick selection takes the least time (17 minute delay) and as a
result is the least precise. The Normal selection applies an average of the two (34 minute
delay).
A relay is available on the Moisture Analog Output Setup Screen (see page 66) to signal
that a zero calibration is taking place, and the analog output signal can also be frozen or
allowed to update during the calibration process.
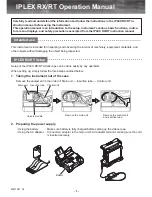
7.5.3 Moisture Data History Routine
Figure 28: Moisture Data History
The Data History Screen (Figure 29) enables the user to see the data history displayed in
strip chart form on the front display. By default, the data history screen displays data for
the most recent 24 hour period sampled at a rate of 1 point per minute (fixed) and the y-
axis is auto-scaling. Note, the Data History Screen is also accessed from the Data
Downloader screen (Figure 33).
The
Next
button can be used to toggle the X axis scale from 1 day (default), to 1 hour, to 1
week or to 3 weeks. The
Next
button can also toggle the cursor to the max and min values
on the Y axis. The arrow keys (
and
can then be used to adjust the values, and the
display will actively update.
The data history may be downloaded to a USB memory stick ( Flash Drive) by using the
Next
key to move to the
Download
box and hitting
Enter.
A screen will appear, (see
Summary of Contents for NanoTrace DF-760E
Page 1: ...NanoTrace Dual Moisture Oxygen Analyzer DF 760E Instruction Manual...
Page 4: ......
Page 38: ......
Page 44: ......
Page 122: ......
Page 128: ......
Page 138: ......
Page 142: ......
Page 143: ...Service DF 760E 139...
Page 144: ...140 DF 760E...
Page 148: ......
Page 166: ......
Page 168: ......
Page 171: ...DF 760E 167...
Page 174: ...170 DF 760E Appendix A User Menu Screens Page 88 Page 91 Page 93 Page 97 Page 98 Page 99...
Page 176: ...172 DF 760E Appendix A User Menu Screens Page 110 Page 111 Page 113 Page 114 Page 115 Page 116...