


System Overview
R&S
®
ZVA
57
Quick Start Guide 1145.1090.62 ─ 10
Trace Types
The analyzer uses traces to display the current measurement result in a diagram area
but is also capable of storing traces to the memory, recalling stored traces, and defining
mathematical relations between different traces. There are three basic trace types:
●
Data traces show the current measurement data and are continuously updated as
the measurement goes on. Data traces are dynamic traces.
●
Memory traces are generated by storing the data trace to the memory. They represent
the state of the data trace at the moment when it was stored. Memory traces are static
traces which can be stored to a file and recalled.
●
Mathematical traces are calculated according to a mathematical relation between
constants and the data or memory traces of the active setup. A mathematical trace
that is based on the active data trace is dynamic.
It is possible to generate an unlimited number of memory traces from a data trace and
display them together. Markers and marker functions are available for all trace types.
The trace type of each trace in a diagram area is indicated in the trace list. You can also
make each trace "Invisible" without deleting it.
Trace List and Trace Settings
The main properties of all traces assigned to the diagram area are displayed in the trace
list in the upper left corner.
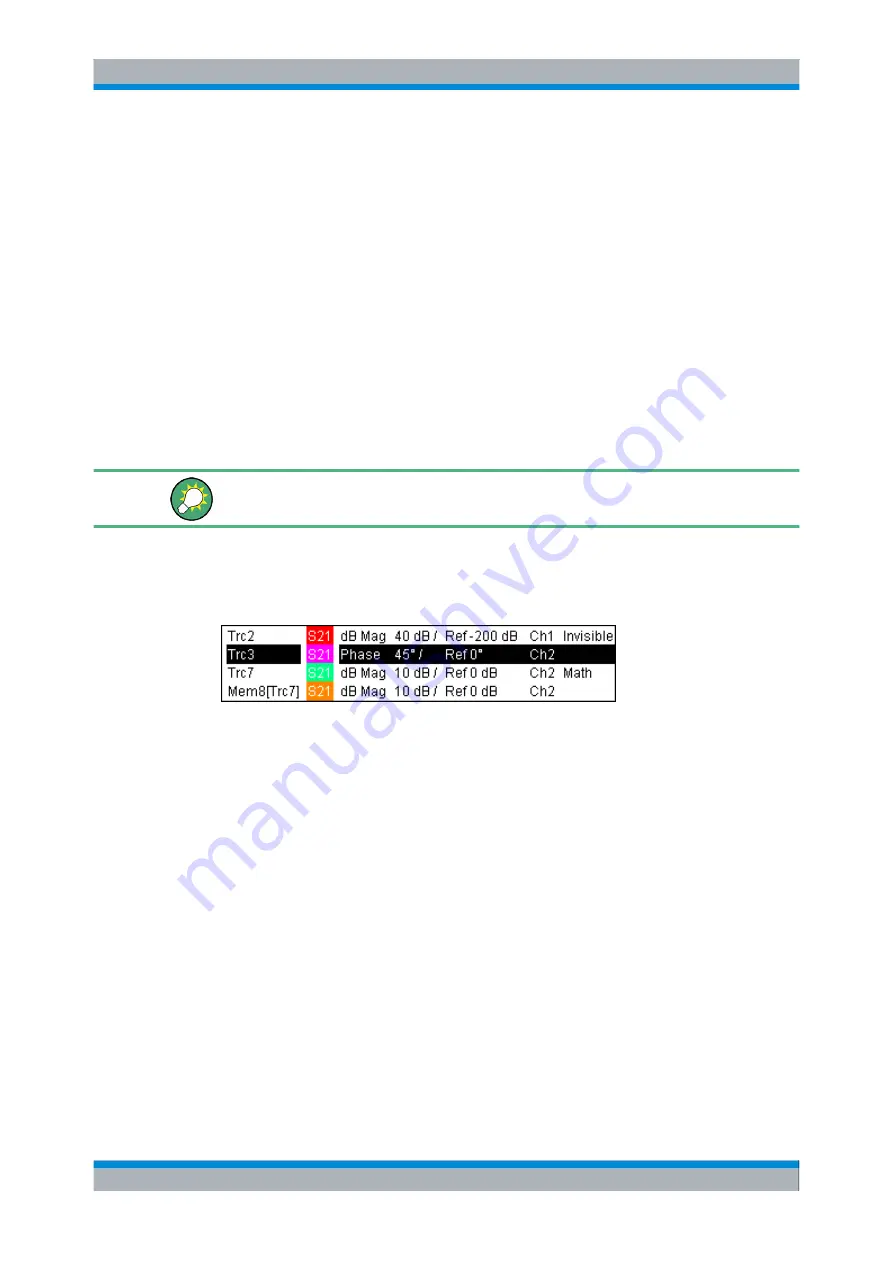
Each line in the trace list describes a single trace. The active trace is highlighted. The
lines are divided into several sections with the following contents (from left to right):
●
The
trace name
appears in the first section. The default names for new traces are
Trc<n> where <n> is a current number. A "Mem..." preceding the trace name indi-
cates a memory trace. Right-click the section and call the "Trace Manager" from the
context menu to change the trace name.
●
The
measured quantity
(e.g. an S-parameter or a ratio) appears on a colored back-
ground. The measured quantity of the active trace is also displayed in the diagram
area below the trace list.
●
The
format
section shows how the measured data is presented in the graphical dis-
play ("Trace
–
Format").
●
The next sections show the value of the vertical or radial diagram divisions ("Scale
Div.") and the reference value ("Ref").
●
The
channel
section shows the channel that each trace is assigned to. It is omitted
if the all traces in the diagram area are assigned to the same channel.
●
The
type
section indicates "Invisible" if a trace is hidden and "Math" if the trace is a
mathematical trace. "GAT" indicates that a time gate is active for the trace. Right-
click the trace name and click "Show Data" or "Show Mem" from the context menu
Screen Elements


