Rohde & Schwarz FSH4 Operating Manual Download Page 81

R&S FSH 

Spectrum Analyzer Mode 

Performing Spectrum Measurements 

Operating Manual 1309.6275.12 - 14 

62 

You can create and edit standards with the R&S FSH4View software and transfer them 
to the R&S FSH via the USB or the LAN interface. The number of standards the 
R&S FSH can store in its memory depends on the number of other data sets stored on 
the R&S FSH. For more information see "

Saving and Loading Instrument Settings and 

Measurement Results

on page 213. 

2.1.5.2  Optimizing Measurement Settings 

After selecting the standard and applying the signal to the R&S FSH, you can optimize 
measurement settings to avoid overloading the R&S FSH. 

M

Press the "Adjust Settings" softkey.

The R&S FSH performs a measurement to determine the ideal reference level ans 
span.. 

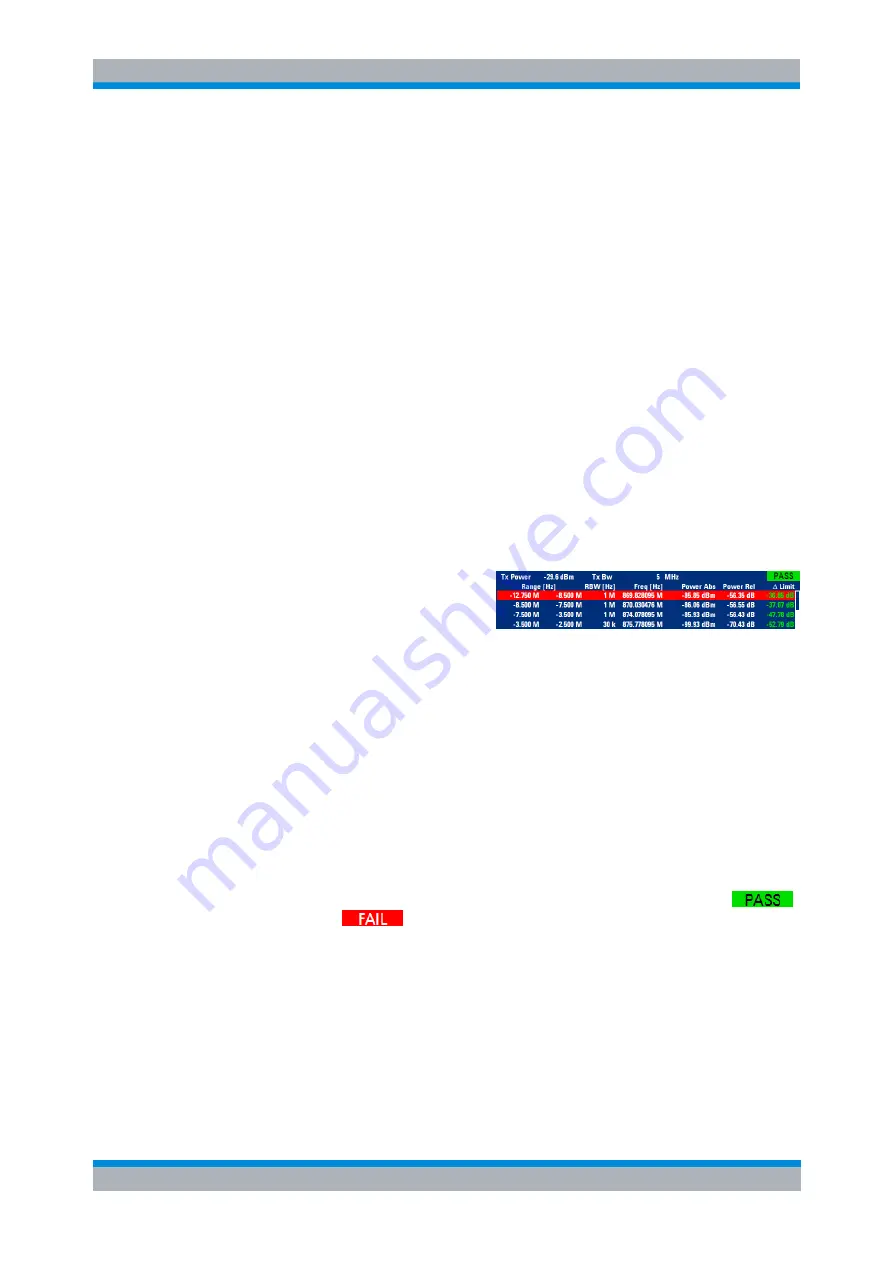
2.1.5.3  Viewing the Results in a Table 

You can add a table to the display that shows the measurement results in numerical 
form. 

M

Press the MEAS key. 

M

Press the "View List" softkey. 

The R&S FSH shows a list above 
the trace diagram. 

If the list contains more than four entries, you can scroll through the list with the 
rotary knob or the cursor keys to see the other results. Note that scrolling works 
only if there is no active input field. 

The list contains the following information: 

C

Tx Power 

Power level of the transmission channel. 

C

Tx Bandwidth 

Bandwidth of the transmission channel. 

C

PASS / FAIL information 

If the signal is within the limits of the spectral mask, the R&S FSH shows 

,

if not it shows 

.

C

Range [Hz] 

Frequency range. The first number is the start frequency, the second number the 
stop frequency of each defined frequency range. The character following the 
number indicates the unit (k = kHz, M = MHz, G = GHz) 

C

RBW [Hz] 

Resolution bandwidth the corresponding frequency range is measured with. 

Summary of Contents for FSH4

Page 1: ...R S FSH4 8 Spectrum Analyzer Operating Manual 1309 6275 12 14 Test Measurement Operating Manual ...

Page 2: ...4 5787 02 R S FSH K47E 1304 5806 02 R S FSH K50 1304 5735 02 R S FSH K50E 1304 5793 02 R S FSH K51 1304 5812 02 R S FSH K51E 1304 5829 02 The contents of this manual correspond to firmware version 2 00 or higher 2012 Rohde Schwarz GmbH Co KG Muehldorfstr 15 81671 Munich Germany Phone 49 89 4129 0 Fax 49 89 4129 12 164 E mail info rohde schwarz com Internet http www rohde schwarz com 81671 Munich G...

Page 3: ... in an appropriate manner This product is designed for use solely in industrial and laboratory environments or if expressly permitted also in the field and must not be used in any way that may cause personal injury or property damage You are responsible if the product is used for any intention other than its designated purpose or in disregard of the manufacturer s instructions The manufacturer sha...

Page 4: ... are in accordance with the standard definition for civil applications in the European Economic Area Definitions that deviate from the standard definition may also exist in other economic areas or military applications It is therefore essential to make sure that the tags described here are always used only in connection with the related product documentation and the related product The use of tags...

Page 5: ...proper operating condition By taking appropriate safety measures and carefully laying the power cable you can ensure that the cable will not be damaged and that no one can be hurt by for example tripping over the cable or suffering an electric shock 4 The product may be operated only from TN TT supply networks fused with max 16 A higher fuse only after consulting with the Rohde Schwarz group of co...

Page 6: ...ries or material damage may occur It is the responsibility of the employer operator to select suitable personnel for operating the products 2 Before you move or transport the product read and observe the section titled Transport 3 As with all industrially manufactured goods the use of substances that induce an allergic reaction allergens such as nickel cannot be generally excluded If you develop a...

Page 7: ...33 standard 1 Cells must not be taken apart or crushed 2 Cells or batteries must not be exposed to heat or fire Storage in direct sunlight must be avoided Keep cells and batteries clean and dry Clean soiled connectors using a dry clean cloth 3 Cells or batteries must not be short circuited Cells or batteries must not be stored in a box or in a drawer where they can short circuit each other or wher...

Page 8: ...substances heavy metal dust such as lead beryllium nickel may be released For this reason the product may only be disassembled by specially trained personnel Improper disassembly may be hazardous to your health National waste disposal regulations must be observed Informaciones Elementales de Seguridad Es imprescindible leer y observar las siguientes instrucciones e informaciones de seguridad El pr...

Page 9: ...es correspondientes Si fuera necesaria indumentaria de seguridad para el uso de productos de Rohde Schwarz encontraría la información debida en la documentación del producto en el capítulo correspondiente Guarde bien las informaciones de seguridad elementales así como la documentación del producto y entréguelas a usuarios posteriores Símbolos y definiciones de seguridad Ver documen tación de produ...

Page 10: ... El producto solamente debe ser utilizado según lo indicado por el fabricante respecto a los estados operativos y posiciones de funcionamiento sin que se obstruya la ventilación Si no se siguen las indicaciones del fabricante pueden producirse choques eléctricos incendios y o lesiones graves con posible consecuencia de muerte En todos los trabajos deberán ser tenidas en cuenta las normas nacionale...

Page 11: ... Solamente está permitido el funcionamiento en redes de alimentación TN TT aseguradas con fusibles de 16 A como máximo utilización de fusibles de mayor amperaje solo previa consulta con el grupo de empresas Rohde Schwarz 5 Nunca conecte el enchufe en tomas de corriente sucias o llenas de polvo Introduzca el enchufe por completo y fuertemente en la toma de corriente La no observación de estas medid...

Page 12: ...nto a aptitudes físicas psíquicas y emocionales ya que de otra manera no se pueden excluir lesiones o daños de objetos El empresario u operador es responsable de seleccionar el personal usuario apto para el manejo del producto 2 Antes de desplazar o transportar el producto lea y tenga en cuenta el capítulo Transporte 3 Como con todo producto de fabricación industrial no puede quedar excluida en ge...

Page 13: ...aterías y acumuladores con electrolitos alcalinos p ej celdas de litio debe seguir el estándar EN 62133 1 No deben desmontarse abrirse ni triturarse las celdas 2 Las celdas o baterías no deben someterse a calor ni fuego Debe evitarse el almacenamiento a la luz directa del sol Las celdas y baterías deben mantenerse limpias y secas Limpiar las conexiones sucias con un paño seco y limpio 3 Las celdas...

Page 14: ...d del fabricante del medio de transporte o elevación utilizado 2 Si se utiliza el producto dentro de un vehículo recae de manera exclusiva en el conductor la responsabilidad de conducir el vehículo de manera segura y adecuada El fabricante no asumirá ninguna responsabilidad por accidentes o colisiones No utilice nunca el producto dentro de un vehículo en movimiento si esto pudiera distraer al cond...

Page 15: ... batteries and rechargeable batteries in the basic safety instructions Información para el cliente relativa a la Ley de Baterías BattG Este equipo contiene una batería o acumulador que no se deben desechar en los con tenedores de basura domésticos Después de la vida útil la batería solo se podrá eliminar en un depósito apropiado o en un centro de atención al cliente de Rohde Schwarz Le rogamos que...

Page 16: ...ance with EN 50419 Once the lifetime of a product has ended this product must not be disposed of in the standard domestic refuse Even disposal via the municipal collection points for waste electrical and electronic equipment is not permitted Rohde Schwarz GmbH Co KG has developed a disposal concept for the environmental friendly disposal or recycling of waste material and fully assumes its obligat...

Page 17: ...rument up to date and to be informed about new application notes related to your instrument please send an e mail to the Customer Support Center stating your instrument and your wish We will take care that you will get the right information Europe Africa Middle East Phone 49 89 4129 12345 customersupport rohde schwarz com North America Phone 1 888 TEST RSA 1 888 837 8772 customer support rsa rohde...

Page 18: ...ment system stan dards The Rohde Schwarz quality management system is certified according to standards such as ISO9001 and ISO14001 Environmental commitment Energy efficient products J J Continuous improvement in J J environmental sustainability ISO14001 certified environmental J J management system Cher client Vous avez choisi d acheter un pro duit Rohde Schwarz Vous disposez donc d un produit fa...

Page 19: ......

Page 20: ...Firmware 20 1 8 Installing Firmware Options 20 1 9 Menu and Softkey Overview 21 1 9 1 General Functions 21 1 9 1 1 General R S FSH Setup 21 1 9 1 2 File Management 22 1 9 1 3 Operating Mode Selection 22 1 9 2 Functions of the Spectrum Analyzer 23 1 9 2 1 Measurement Selection 23 1 9 2 2 Frequency Parameters 25 1 9 2 3 Span Selection 25 1 9 2 4 Amplitude Parameters 26 1 9 2 5 Sweep Configuration 26...

Page 21: ... 4 6 Bandwidth Selection 33 1 9 4 7 Trace Functionality 33 1 9 4 8 Markers 33 1 9 5 Functions of the Power Meter 34 1 9 5 1 Power Meter Measurements 34 1 9 5 2 Frequency Parameters 34 1 9 5 3 Amplitude Parameters 35 1 9 5 4 Sweep Configuration 35 1 9 6 Functions of the Distance to Fault Mode 35 1 9 6 1 Measurement Configuration 35 1 9 6 2 Frequency Parameters 36 1 9 6 3 Span Selection 36 1 9 6 4 A...

Page 22: ...ard 47 2 1 2 2 Setting the Reference Level 47 2 1 2 3 Setting the Channel Bandwidth 48 2 1 2 4 Defining the Percentage of Occupied Bandwidth 48 2 1 2 5 Changing the Span 49 2 1 3 Power Measurements on TDMA Signals 49 2 1 3 1 Selecting a Standard 50 2 1 3 2 Setting the Burst Length 51 2 1 3 3 Setting the Reference Level 51 2 1 3 4 Using a Trigger 51 2 1 4 Measuring the Adjacent Channel Leakage Rati...

Page 23: ... 2 1 8 3 Configuring the Display 70 2 1 8 4 Recording a Spectrogram 72 2 1 8 5 Playback of a Spectrogram 73 2 1 9 Using Isotropic Antennas 75 2 2 Configuring Spectrum Measurements 77 2 2 1 Configuring the Horizontal Axis 77 2 2 1 1 Defining the Center Frequency 77 2 2 1 2 Defining a Frequency Step Size 78 2 2 1 3 Setting a Frequency Offset 78 2 2 1 4 Defining a Start and Stop Frequency 79 2 2 1 5 ...

Page 24: ...rkers 96 2 2 6 1 Positioning Markers 97 2 2 6 2 Positioning a Delta Marker 98 2 2 6 3 Selecting the Marker Type 99 2 2 6 4 Automatic Positioning of Markers 99 2 2 6 5 Removing Markers 99 2 2 6 6 Using Marker Search Limits 100 2 2 6 7 Using Marker Functions 101 2 2 7 Using Display Lines 105 2 2 8 Using Limit Lines 105 2 2 8 1 Selecting a Limit Line 106 2 2 8 2 Performing Limit Checks 107 2 3 Workin...

Page 25: ... FSH K42 132 4 3 1 Measuring the Transmission 133 4 3 2 Measuring the Reflection 134 4 4 Evaluating the Results 136 4 4 1 Selecting the Measurement Format 136 4 4 1 1 Working with the Smith Chart 138 4 4 1 2 Working with the Dual Trace Mode 141 4 4 2 Configuring the Vertical Axis 142 4 4 3 Using Markers 145 4 4 4 Working with Channel Tables 145 4 4 5 Using Limit Lines 145 4 4 6 Using Trace Mathema...

Page 26: ...eating a Cable Model 156 5 2 1 3 Working with a DTF List 157 5 2 2 Configuring the Horizontal Axis 158 5 2 2 1 Setting the Frequency Range for DTF Measurements 158 5 2 2 2 Selecting the Cable Length 159 5 2 3 Configuring the Vertical Axis 160 5 2 3 1 Adjusting the Scale of the Diagram 160 5 2 3 2 Setting the Attenuation 161 5 2 4 Using Markers 162 5 2 5 Using Display and Limit Lines 162 6 Receiver...

Page 27: ... 182 7 2 3 The Code Domain Channel Table 182 7 2 3 1 Header Table 183 7 2 3 2 Global Results 183 7 2 3 3 Channel Table 183 7 2 4 Configuring the Measurement 184 7 2 4 1 Specifying the Scrambling Code 184 7 2 4 2 Setting the Antenna Diversity 185 7 2 4 3 Selecting the Slot and Code Channel 185 7 2 4 4 Changing the Code Power 186 7 2 4 5 Performing Fast Measurements 186 7 3 Measurements on CDMA2000 ...

Page 28: ...7 7 4 1 2 Global Results 198 7 4 1 3 Channel Results 199 7 4 2 The PN Scanner 199 7 4 3 The Burst Power Result Display 200 7 4 4 Configuring the Measurement 200 7 4 4 1 Selecting the Unit of the Carrier Frequency Error 200 7 4 4 2 Changing the PN Offset 200 7 4 4 3 Synchronizing to a Base Station Using a GPS Receiver 201 7 5 Measurements on LTE Signals 201 7 5 1 The Result Summary 202 7 5 1 1 Gene...

Page 29: ...r 211 7 5 4 8 Configuring EVM Results 211 8 Saving and Loading Instrument Settings and Measurement Results 213 8 1 Saving Data Sets 213 8 2 Quick Naming of Data Sets 215 8 2 1 Putting Together a File Name 215 8 2 2 Designing a Table 216 8 3 Loading Measurement Results 216 8 3 1 Previewing a Dataset 217 8 3 2 Loading a Dataset 217 8 3 3 Quick Recall of Instrument Settings 217 8 4 Compiling a Measur...

Page 30: ... how to work with the available software options and applications Service Manual The Service Manual provides information on maintenance It covers the following topics C instructions on how to perform a performance test C instructions on how to repair the R S FSH including a spare parts list C mechanical drawings Release Notes The release notes describe the installation of the firmware new and modi...

Page 31: ...KEYS Key names are written in capital letters and enclosed by quotation marks Input Input to be entered by the user is displayed in italics File names commands program code File names commands coding samples and screen output are distinguished by their font Links Links that you can click are displayed in blue font References References to other parts of the documentation are enclosed by quotation ...

Page 32: ...youts that show specifics for each operating mode or measurement are provided in the corresponding sections of this manual 1 Measurement information 13 Horizontal axis labeling 2 GPS status 14 Active menu item 3 Date and time 15 Unavailable menu item 4 Battery status 16 Currently selected menu item 5 Hardware settings 17 Selectable menu item 6 GPS information 18 Input field 7 Marker information 19...

Page 33: ...ding key In case of numeric values each key covers just the number that s printed on it You can enter negative values with the minus sign key and enter values that contain decimal places with the dot key If the R S FSH asks you to enter a character or you need to enter a character e g file names the key assignment changes Each key covers one number and more than one character with the first choice...

Page 34: ...f the unit keys If you confirm a such a value with the ENTER key the R S FSH always uses the smallest possible unit e g Hz C If you have opened a submenu or input field by accident you can close it without making any changes with the CANCEL key 1 2 3 Using the Rotary Knob Using the rotary knob you can do several things C The rotary knob works like a cursor key in dialog boxes or softkey submenus I...

Page 35: ... you prepare a measurement it is recommended to preset the R S FSH During a preset the R S FSH resets all settings to their default state Restoring the default configuration has the advantage that old settings do not affect measurements The default setup is specific to the operating mode M Press the PRESET key The R S FSH restores its default setup You can also define your own default settings via...

Page 36: ...Preference menu M Press the SETUP key M Press the User Preference softkey M Select the Default Filename and File Name Counter Starts At items and assign a file name and number as you wish The file format of screenshots is either png or jpg depending on your configuration in the User Preference menu M Press the SETUP key M Press the User Preference softkey M Select the Capture Screen Format item to...

Page 37: ... enter the wrong PIN three times in a row you have to enter the Master PIN to unlock the R S FSH By default the Master PIN is the same as the OEM Master PIN but you can define a User Master PIN If you unlock the R S FSH with the User Master PIN the PIN is automatically reset to its default value 0000 C OEM Master PIN code made up out of 10 digits If you have defined a User Master PIN and enter the...

Page 38: ... you have to turn it on manually M Press the SETUP key M Press the Instrument Settings softkey The R S FSH shows the Instrument Settings dialog box M Select the PIN Code Protection menu item M Press ENTER The R S FSH opens an input field to define a new PIN M Enter a 4 digit PIN The R S FSH opens an input field to confirm the PIN M Enter the 4 digit PIN again If the PIN confirmation was successful...

Page 39: ...input field to confirm the User Master PIN M Confirm the PIN The R S FSH shows a message if the change was successful or not M Alternatively select the User Master PIN Code menu item and enter a 10 digit PIN in the input field that opens 1 7 Updating the Firmware You can download new firmware versions from the R S FSH website The website also provides release notes for each new firmware version Th...

Page 40: ... overview of all instrument functions in the form of softkey and menu overviews 1 9 1 General Functions General functions are those that are available for all operating modes 1 9 1 1 General R S FSH Setup The SETUP key opens the setup menu that contains functionality to set up the R S FSH in general and functionality to set up the measurement ...

Page 41: ...275 12 14 22 1 9 1 2 File Management The SAVE RECALL key opens the file manager that contains functionality to manage datasets and other files 1 9 1 3 Operating Mode Selection The MODE key opens the mode menu that contains functionality to select the operating mode of the R S FSH ...

Page 42: ...Analyzer This section contains all softkeys and menus that are available in spectrum analyzer mode 1 9 2 1 Measurement Selection The MEAS key opens the measurement menu that contains functionality to select and configure the measurement The spectrogram is available only if you have installed option R S FSH K14 Channel Power ...

Page 43: ...R S FSH Operating the R S FSH Menu and Softkey Overview Operating Manual 1309 6275 12 14 24 Occupied Bandwith TDMA Power Spectrum Emission Mask Harmonic Distortion AM Modulation Depth ...

Page 44: ...4 25 Spectrogram Spectrogram Playback 1 9 2 2 Frequency Parameters The FREQ key opens the frequency menu that contains functionality to set up the horizontal axis of the measurement diagram 1 9 2 3 Span Selection The SPAN key opens the span menu that contains functionality to set the span ...

Page 45: ...T key opens the amplitude menu that contains functionality to set up the vertical axis of the measurement diagram 1 9 2 5 Sweep Configuration The SWEEP key opens a menu that contains all functionality to configure the sweep 1 9 2 6 Bandwidth Selection The BW key opens a menu that contains all functionality to set the bandwidths ...

Page 46: ...ACE key opens the trace menu that contains functionality to set up the traces 1 9 2 8 Display and Limit Lines The LINES key opens a menu that contains the functionality to control display and limit lines 1 9 2 9 Markers The MARKER and MKR keys open a menus to control markers and use marker functions Softkey in the Marker Menu ...

Page 47: ...ns of the Network Analyzer This section contains all softkeys and menus that are available in network analyzer mode Vector network analyzer functionality is available only with option R S FSH K42 1 9 3 1 Measurement Configuration The MEAS key opens the measurement menu that contains functionality to select and configure the measurement ...

Page 48: ...horizontal axis of the measurement diagram 1 9 3 3 Span Selection The SPAN key opens the span menu that contains functionality to set the span 1 9 3 4 Amplitude Parameters The AMPT key opens the amplitude menu that contains functionality to set up the vertical axis of the measurement diagram 1 9 3 5 Sweep Configuration The SWEEP key opens a menu that contains all functionality to configure the swe...

Page 49: ...idth Selection The BW key opens a menu that contains all functionality to set the bandwidths 1 9 3 7 Trace Functionality The TRACE key opens the trace menu that contains functionality to set up the traces 1 9 3 8 Limit Lines The LINES key opens a menu that contains the functionality to control limit lines ...

Page 50: ...R S FSH Menu and Softkey Overview Operating Manual 1309 6275 12 14 31 1 9 3 9 Markers The MARKER and MKR keys open a menus to control markers and use marker functions Softkey in the Marker Menu Softkeys in the Marker To Menu ...

Page 51: ...Measurement Configuration The MEAS key opens the measurement menu that contains functionality to select and configure the measurement Single frequency measurements Channel scans 1 9 4 2 Frequency Parameters The FREQ key opens the frequency menu that contains functionality to set up the horizontal axis of the measurement diagram 1 9 4 3 Amplitude Parameters The AMPT key opens the amplitude menu tha...

Page 52: ...he SWEEP key opens a menu that contains all functionality to configure the sweep 1 9 4 6 Bandwidth Selection The BW key opens a menu that contains all functionality to set the bandwidths 1 9 4 7 Trace Functionality The TRACE key opens the trace menu that contains functionality to set up the traces 1 9 4 8 Markers The MARKER and MKR keys open a menus to control markers and use marker functions Soft...

Page 53: ...s section contains all softkeys and menus that are available in power meter mode 1 9 5 1 Power Meter Measurements The MEAS key opens a menu that contains the functionality to configure measurements with the power meter Power Meter Directional Power Meter 1 9 5 2 Frequency Parameters The FREQ key opens a menu that contains the functionality to set the frequency ...

Page 54: ...SWEEP key opens a menu that contains functionality to configure the sweep 1 9 6 Functions of the Distance to Fault Mode This section contains all softkeys and menus that are available in distance to fault mode Distance to fault functionality is available with option R S FSH K41 1 9 6 1 Measurement Configuration The MEAS key opens the measurement menu that contains functionality to select and confi...

Page 55: ...urement diagram 1 9 6 3 Span Selection The SPAN key opens the span menu that contains functionality to set the span DTF measurements Reflection and spectrum measurements 1 9 6 4 Amplitude Parameters The AMPT key opens the amplitude menu that contains functionality to set up the vertical axis of the measurement diagram 1 9 6 5 Sweep Configuration The SWEEP key opens a menu that contains all functio...

Page 56: ...opens a menu that contains all functionality to set the bandwidths 1 9 6 7 Trace Functionality The TRACE key opens the trace menu that contains functionality to set up the traces 1 9 6 8 Markers The MARKER and MKR keys open a menus to control markers and use marker functions Softkey in the Marker Menu Softkeys in the Marker To Menu ...

Page 57: ...r This section contains all softkeys and menus that are available in digital modulation mode Digital modulation functionality is available only with one of the correposnding options 1 9 7 1 Measurement Configuration The MEAS key opens the measurement menu that contains functionality to select and configure the measurement 3GPP WCDMA CDMA2000 ...

Page 58: ...R S FSH Operating the R S FSH Menu and Softkey Overview Operating Manual 1309 6275 12 14 39 1xEV DO LTE FDD and TDD ...

Page 59: ...o set up the horizontal axis of the measurement diagram 1 9 7 3 Amplitude Parameters The AMPT key opens the amplitude menu that contains functionality to set up the vertical axis of the measurement diagram 3GPP WCDMA and LTE FDD TDD CDMA2000 and 1xEV DO 1 9 7 4 Sweep Configuration The SWEEP key opens a menu that contains all functionality to configure the sweep 3GPP WCDMA and LTE FDD TDD ...

Page 60: ... Manual 1309 6275 12 14 41 CDMA2000 and 1xEV DO 1 9 7 5 Trace Functionality The TRACE key opens the trace menu that contains functionality to set up the traces 3GPP WCDMA and LTE Spectrum Overview and Isotropic Antenna only CDMA2000 and 1xEV DO Spectrum Overview only ...

Page 61: ...er its entire frequency range the channel power measurement measures the power of a specific transmission channel Other signals in the frequency spectrum don t show in the results When measuring the spectrum within a channel the R S FSH uses a resolution bandwidth that is small compared to the channel bandwidth It then determines the total power of the channel by integrating the results on the tra...

Page 62: ...The R S FSH opens a dialog box to select the standard M Select one of the available standards M Confirm the selection with the Select softkey The R S FSH loads the configuration of the selected standard It automatically sets the optimal span resolution bandwidth video bandwidth sweep time and detector for the standard If the measurement is not according to the selected standard anymore e g if you ...

Page 63: ...t to determine the optimal reference level It uses a resolution bandwidth of 1 MHz a video bandwidth of 1 MHz and the peak detector After finishing the automatic measurement the R S FSH sets the optimal reference level 2 1 1 3 Setting the Channel Bandwidth The channel bandwidth specifies the frequency range around the center frequency over which the R S FSH performs the power measurement M Press t...

Page 64: ... The R S FSH again calculates the span automatically 2 1 1 5 Measuring the Maximum Channel Power If signal levels fluctuate significantly you can define the maximum channel power with the Max Hold function M Press the MEAS key M Press the Power Display softkey M Select the Max Hold menu item The power display switches from Power to Max Power If you want to deactivate the Max Hold function and retu...

Page 65: ...setting If you need another percentage for the occupied bandwidth you can set values from 10 to 99 9 After entering the channel bandwidth the R S FSH automatically selects the measurement parameters so that you can attain the best result M Press the MEAS key M Press the Meas Mode softkey The R S FSH opens the measurement menu M Select the Occupied BW menu item The R S FSH starts to measure the occ...

Page 66: ... 213 If you make changes to the settings or create datasets note that C the span is always coupled to the channel bandwidth Changes to either of those automatically adjust the other 5 x channel bandwidth C the resolution bandwidth should be between 1 and 4 of the channel bandwidth This ensures that the occupied bandwidth is measured with high accuracy C the video bandwidth must be at least three t...

Page 67: ...easurement M Press the MEAS key M Press the Chan BW softkey The R S FSH opens an input field to specify the channel bandwidth M Enter the channel bandwidth you need The R S FSH sets the appropriate span for the channel bandwidth that you have entered span 5 x channel bandwidth This ensures that no incorrect channel power measurements are made The minimum channel bandwidth that you can set is 2 kHz...

Page 68: ...ower measurement would be increasingly imprecise because too few points of the trace occur in the channel to be measured M Press the Auto Span softkey The R S FSH again calculates the span automatically 2 1 3 Power Measurements on TDMA Signals When TDMA time division multiple access methods are used e g for GSM several users share a channel Each user is assigned a period of time or timeslot With t...

Page 69: ...GSM EDGE standard However you can create new configurations to perform measurements on other standards as well M Press the MEAS key M Press the Standard softkey The R S FSH opens a dialog box to select the standard M Select one of the available standards M Confirm the selection with the Select softkey The R S FSH loads the configuration of the selected standard It automatically sets the optimal se...

Page 70: ...rence level Because the resolution bandwidths of the R S FSH are implemented digitally after the A D converter the signal level at the A D converter can be higher than the level indicated by the trace depending on the selected resolution bandwidth To prevent the A D converter from being overloaded the signal must be measured at the widest resolution bandwidth and video bandwidth with the peak dete...

Page 71: ... to measure the power over more than one transmission channel and also evaluate the power of the adjacent or alternate channels of the transmission channel The ACLR performs measurements according to a specific channel configuration e g a particular radio communications standard M Press the MEAS key M Press the Meas Mode softkey The R S FSH opens the measurement menu M Select the ACLR menu item Th...

Page 72: ... settings make sure to consider the following points to get valid and accurate measurement results C Reference level Make sure not to overload the R S FSH as the power is measured with a resolution bandwidth that is small in comparison with the signal bandwidth As with Channel Power measurements automatically set the reference to an optimal level with the Level Adjust softkey C Setting the span Th...

Page 73: ...lution bandwidth of 30 kHz is used This yields correct results since the spectrum in the neighborhood of the adjacent channels normally has a constant level For standard NADC IS136 this would not be not possible for example since the spectrum of the transmit signal penetrates into the adjacent channels and a too large resolution bandwidth causes a too low selection of the channel filter The adjace...

Page 74: ...to calculate the power in the channel the sample detector would yield less stable results 2 1 4 1 Selecting a Standard If you need to perform measurements that are conform to a telecommunications standard you can activate one of the predefined standards that are already stored in the R S FSH memory Those predefined standards have already been set up to yield the best results However the R S FSH pr...

Page 75: ...er of adjacent channels M Enter the number of adjacent alternate channels you need for the measurement The borders of Tx channels are displayed red in the trace diagram the borders of adjacent and alternate channels are displayed green Setting the channel bandwidth The channel bandwidth specifies the frequency range around the center frequency over which the R S FSH performs the power measurement ...

Page 76: ...ey M Press the Channel Settings softkey M Select the Channel Spacing menu item The R S FSH opens a dialog box to define the spacings for all transmission channels and adjacent alternate channels M Select the channel you want to change the spacing for M Activate the input by pressing the ENTER key M Enter the channel spacing you need The R S FSH now takes the new values into account for future meas...

Page 77: ...T2 80 kHz ALT3 100 kHz ALT4 120 kHz ALT5 and so on If you then change the spacing of the third alternate channel ALT3 to 100 kHz the R S FSH adjusts the alternate channels above the third one accordingly 125 kHz ALT4 150 kHz ALT5 and so on 2 1 4 3 Normalization of Measurement Results By default the power of the channels and adjacent channels is displayed in the unit dBm It is also possible to disp...

Page 78: ...owest power level is the reference channel Max Power Tx Channel The channel with the highest power level is the reference channel Lowest Highest Channel The outer left hand transmission channel is the reference channel for the lower adjacent channels The outer right hand transmission channel is the reference channel for the upper adjacent channels 2 1 4 6 Setting and Checking the Limits Limit chec...

Page 79: ...t the Check Channel Limits menu item The R S FSH automatically performs limit checks The results of the limit check are displayed in the table above the trace If a result fails the limit check it turns red and has a star in front of its power level 2 1 5 Measuring the Spectrum Emission Mask The Spectrum Emission Mask SEM measurement is a method to detect spurious emissions or intermodulation produ...

Page 80: ...ne 7 Marker blue line 8 SEM softkey menu 2 1 5 1 Selecting a Standard If you need to perform measurements that are conform to a telecommunications standard you can activate one of the predefined standards that are already stored in the R S FSH memory However you can create new configurations to perform measurements on other standards as well M Press the MEAS key M Press the Standard softkey The R ...

Page 81: ... the Results in a Table You can add a table to the display that shows the measurement results in numerical form M Press the MEAS key M Press the View List softkey The R S FSH shows a list above the trace diagram If the list contains more than four entries you can scroll through the list with the rotary knob or the cursor keys to see the other results Note that scrolling works only if there is no a...

Page 82: ...rmonics this measurement mode also calculates the Total Harmonic Distortion THD and shows the results You can perform a Harmonic Distortion measurement in frequency sweep span 0 and zero span mode span 0 When starting the measurement the R S FSH looks for the first harmonic of the signal the highest signal in the defined frequency range It then adjusts the frequency axis so that all harmonics are ...

Page 83: ...and its first harmonic Each harmonic is indicated by a marker that the R S FSH places on the harmonic here M1 and M2 Note that all of the markers that have been set are normal markers that show the absolute frequency of the harmonic At the same time the R S FSH also calculates the values for the total harmonic distortion THD and shows the results in a box above the trace diagram The values are out...

Page 84: ...an AM modulated signal M Press the MEAS key M Press the Meas Mode softkey The R S FSH opens the measurement menu M Select the AM Modulation Depth menu item The R S FSH starts to measure the AM modulation depth After you have started the measurement the R S FSH places three markers on the trace The first marker is placed on the peak power level The R S FSH assumes that position as the level of the ...

Page 85: ...al must have If the power of the signal is below the threshold the R S FSH will not set the markers and therefore will not calculate the modulation depth M Press the MEAS key M Press the Threshold softkey The R S FSH opens an input field to set the threshold M Enter the threshold value you need The threshold is represented as a horizontal blue line in the diagram area 2 1 7 2 Optimizing the Settin...

Page 86: ...s chronologically from top to bottom Therefore the top of the diagram is the present A third dimension shows the amplitude for each frequency by mapping different colors to every power level The result is therefore a two dimensional diagram The color the R S FSH assigns to a power level that was measured depends on C the color table you have selected C the spectrogram reference level C the spectro...

Page 87: ... of the R S FSH The R S FSH stores 1024 frames or spectrums that have been measured in its memory As the height of the display is smaller some of the data becomes invisible after a time 2 1 8 1 Controlling the Spectrogram Update The spectrogram starts running as soon as you enter the spectrogram mode if you are in continuous sweep mode If you are in single sweep mode the R S FSH does not add a lin...

Page 88: ...results For this purpose the spectrogram has an invisible scrollbar that you can use to scroll up and down the spectrogram to the frame that you d like to see Scrolling through the spectrogram Turn the rotary knob or use the UP and DOWN cursor keys whenever you are viewing the spectrogram The R S FSH scrolls through the spectrogram history Note that this is only possible as long as no input field ...

Page 89: ...ou can eliminate amplitudes from the color map that are not part of the signal Example By default the spectrogram reference level is 30 dBm That means that signal parts with an amplitude of 30 dBm would be yellow in the spectrogram and signal parts with a very small amplitude would be dark green Everything in between is a shade of the colors between As the colors are distributed over a very large ...

Page 90: ... therefore exactly the same as in the previous picture The result however still does not show signal differences in detail The only thing that happened is that the colors have shifted in the example to yellow because the color that corresponds to the reference level has shifted from green to yellow All other colors that are part of the color scheme are still unused because the spectrogram level ra...

Page 91: ... show details of the noise floor and exclude the peak levels you have to lower the spectrogram reference level until it is just above the noise floor The R S FSH will then display the signal parts that are above the reference level in only one color which is the color at the upper border of the color map 2 1 8 4 Recording a Spectrogram You can save the data of the spectrogram for documentation or ...

Page 92: ... the same things on a recalled spectrogram as in the spectrogram recording mode e g customize the display to your needs In addition to that functionality it is possible to view not only the spectrum that belongs to the currently selected spectrogram frame but also the spectrums of all frames that are in the memory of the R S FSH Working with time lines in playback mode To find a particular point i...

Page 93: ...e top most frame M Press the Select Time Line softkey again The R S FSH opens an input field to define the position of the second time line T2 M Enter a number with the number keys the rotary knob or the cursor keys The R S FSH positions the second time line on the selected frame Again it shows the time stamp of the time line in the marker information field UT value For the second time line T2 the...

Page 94: ...ogram M Press the Live Update softkey at any time you are in playback mode The R S FSH switches back to performing live measurements 2 1 9 Using Isotropic Antennas If you need to determine the field strength you can connect an isotropic antenna R S TS EMF order no 1158 9295 13 to the R S FSH The antenna works in the frequency range from 30 MHz to 3 GHz The antenna has three orthogonal elements for...

Page 95: ...e Meas Mode softkey M Select the Isotropic Antenna menu item The R S FSH includes the antenna in all relevant measurements Before displaying final measurement results the R S FSH performs a measurement for each of the three antenna axis The update rate of the trace decreases accordingly Automatic antenna detection If you connect an isotropic antenna made by Rohde Schwarz the R S FSH automatically ...

Page 96: ...pecify the frequency in terms of the center frequency or by defining a start and stop frequency for a particular span If you know the frequency of the signal you are measuring it is best to match the center frequency to the signal s frequency If you are investigating signals e g harmonics that are within a particular frequency range the best option is to enter a start and stop frequency to define ...

Page 97: ...y automatically moves to the next harmonic Manual Define any step size you want This step size makes it easy to investigate a spectrum with frequencies at constant intervals M Select the step size you need from the menu The R S FSH adjusts the step size accordingly If you set the step size to 10 of the span or to the center frequency the R S FSH sets the step size internally Manually defining the ...

Page 98: ...e start frequency and ending with the stop frequency If you have entered a stop frequency that is outside the maximum frequency range the R S FSH sets the stop frequency to the possible maximum The label of the horizontal axis changes from Center and Span to Start and Stop 2 2 1 5 Setting the Span The span is the frequency range around the center frequency that a spectrum analyzer displays on the ...

Page 99: ...key M Press the Zero Span softkey The R S FSH sets a span of 0 Hz and performs the measurement in the time domain 2 2 2 Configuring the Vertical Axis All relevant settings to configure the vertical axis are available in the amplitude menu You can access it via the AMPT key 2 2 2 1 Setting the Reference Level The reference level is represented graphically by the grid line at the top of the diagram ...

Page 100: ...e display range determines the scaling or resolution of the vertical axis In the default state the display range is a logarithmic scaling over a 100 dB This corresponds to 10 dB per grid division The R S FSH provides other display ranges that either increase or decrease the resolution of the vertical axis However increasing resolution does not increase the accuracy of for example the marker level ...

Page 101: ...ffset other than 0 the R S FSH puts a red dot at the Ref hardware setting 2 2 2 5 Setting the RF Attenuation RF attenuation adjusts the input range inside the analyzer It is coupled directly to the reference level If you have set a high reference level RF attenuation is turned on in 10 dB steps according to the table below so that the input mixer always remains in the linear range The R S FSH prov...

Page 102: ...Bm 35 dB 40 dB 40 dB 40 dB 26 to 30 dBm 40 dB 40 dB 40 dB 40 dB M Press the AMPT key M Press the RF Att Amp Imp softkey M Select either the Auto Low Distortion or the Auto Low Noise menu item The R S FSH sets the attenuation according to the table above M Select the Manual 0 dB menu item for manual selection of the RF attenuation The R S FSH opens an input field to set the RF attenuation You can s...

Page 103: ...e R S FSH You can access it with the BW key 2 2 3 1 Setting the Resolution Bandwidth The resolution bandwidth in a spectrum analyzer determines the frequency resolution for frequency domain measurements and therefore determines how well it can separate adjacent frequencies The results as you see them on the display depend on the passband of a resolution filter The resolution bandwidth RBW has seve...

Page 104: ...kipped In the R S FSH s default state the resolution bandwidth is coupled to the span i e if you change the span the R S FSH adjusts the resolution bandwidth Therefore you do not have to set the resolution bandwidth manually in many cases because the R S FSH automatically sets the resolution bandwidth if you change the span M Press the BW key By default the resolution bandwidth is coupled to the s...

Page 105: ...ter is less than the frequency of the AC component it is suppressed depending on its maximum frequency If the AM component should be displayed truly the cutoff frequency of the filter has to be greater than the modulation frequency If there is noise on the sine signal the modulation signal can be thought of as noise If the video bandwidth is reduced the high frequency noise components above the cu...

Page 106: ...he R S FSH to get the results that are contained in one trace In the frequency domain span 0 the sweep time is the time it takes the R S FSH to measure the spectrum in the specified span To avoid the display of spurs in the spectrum the sweep time has to meet some conditions C The sweep time depends on the resolution bandwidth If the sweep time is too short the resolution filter has no time to set...

Page 107: ... sweep a certain number of times depending on the number of averages you have set over the defined range of the horizontal axis frequency or time and then stops measuring It performs another sweep only after you tell it to For more information on setting the number of sweeps included in a single sweep see Selecting the Trace Mode Average M Press the SWEEP key M Press the Single Sweep softkey The R...

Page 108: ...ate signal becoming active the next time the measurement is resumed etc Pulsed signals can be measured by this method if the gate delay and gate length are selected in a way that the measurement is only performed while the pulse is active Gated measurements are possible in the frequency domain span 0 and the time domain span 0 but it is available only in combination with an external gate signal M ...

Page 109: ...vel by adding a horizontal line to the diagram area Performing Gated Sweeps When the external trigger is active it is possible to perform a gated sweep M Press the SWEEP key M Press the Trigger softkey M Activate an external trigger Now that the external trigger is active the Gated Trigger menu item becomes available M Press the Trigger softkey again M Select the Gated Trigger menu item In order t...

Page 110: ...ts with the measurement until the next gate signal happens The delay time and gate length are represented by vertical red lines in the diagram area M After setting the gate delay and gate length exit the gate settings menu with the Exit softkey The R S FSH returns to the frequency domain provided it was active before setting up the gated trigger The original span is restored The R S FSH is ready t...

Page 111: ...old trace change a parameter in a way that the results can not be compared any more e g the span Using the min hold trace mode is a good way to highlight signals within noise or suppress intermittent signals Using the min hold trace mode automatically activates the min peak detector C View The view trace mode freezes the current trace and aborts the measurement Using the view trace mode is a good ...

Page 112: ...e depends on the magnitude of the signal fluctuation The auto peak detector is the default detector C Max Peak If the max peak detector is active the R S FSH displays only the maximum power levels that were measured in the frequency range covered by a pixel The max peak detector is useful for measurements on pulse or FM signals for example C Min Peak If the max peak detector is active the R S FSH ...

Page 113: ...ace pixel or the selected resolution bandwidth whichever is larger Otherwise the power the R S FSH shows is too low because there are spectral components within the frequency range covered by the pixel that do not originate from the signal you want to observe e g noise To get the true power the video bandwidth VBW should also be greater than the resolution bandwidth RBW Otherwise an averaging effe...

Page 114: ...etector or trace mathematics apply to the active trace The trace indicator shows the currently active trace with a white background M Press the Select Trace softkey Trace 1 becomes the active trace You can put both traces into the internal memory of the R S FSH and restore them later Note that the memory trace 1 and memory trace 2 have the same color i e white 2 2 5 4 Working with Memory Traces Yo...

Page 115: ...d then display the results M Press the TRACE key M Press the Trace Memory softkey M Press the Show softkey M Press the Trace Math softkey M Select the Trace Memory or Memory Trace menu item The R S FSH calculates and shows the resulting trace M To turn off trace mathematics select the Off menu item 2 2 6 Using Markers The R S FSH has six markers five of which can be used as either markers or delta...

Page 116: ...marker frequency is the frequency difference between the frequency at the point marked by the main marker and the frequency at the point marked by the delta marker To measure complex signals you can activate up to six markers Marker 1 is always a normal marker and the reference of all delta markers Markers 2 to 6 are either markers or delta markers depending on your set up Screen Layout with Activ...

Page 117: ...n turn it off and on again whenever you like M Press the View List softkey The marker list turns off or on depending on its original state 2 2 6 2 Positioning a Delta Marker When a normal marker is already in use you can add delta markers M Press the MARKER key M Press the New Marker softkey The R S FSH activates a delta marker and positions it on the next maximum level that has been measured In a...

Page 118: ...s that make setting the markers easier or allow to make instrument settings on the basis of the current marker position C Set to Peak The Peak function places the active marker or the delta marker on the highest level value of the trace C Set to Next Peak The Next Peak function places the active marker or delta marker on the next highest level value of the trace relative to its current position C ...

Page 119: ...ta markers Removing all markers at the same time M Press the MARKER key M Press the Delete Marker softkey M Select the Delete All menu item M Confirm the selection with the ENTER key The R S FSH deletes all markers and delta markers 2 2 6 6 Using Marker Search Limits The R S FSH allows you to use only a limited section of the trace for the Set to Peak Set to Next Peak and Minimum functions M Press...

Page 120: ...on to the frequency and level readout the R S FSH provides several more complex marker functions in spectrum analyzer mode Deactivating marker functions Selecting a marker function again while it is still active turns that marker function off Measuring the Noise Power Density The marker noise function calculates the noise power density at the marker position in dBm Hz The R S FSH includes several ...

Page 121: ...uency counter however you can get a more accurate result of the horizontal marker position If the frequency counter is active the R S FSH stops the measurement at the marker position for a short time and measures the frequency using the internal reference frequency The accuracy of the results therefore depends only on the accuracy of the internal reference frequency TCXO The frequency counter has ...

Page 122: ...n for example for measurements on notch filters M Press the MARKER key M Press the Marker Function softkey M Select the n dB Down menu item The R S FSH displays two temporary markers on the left and on the right of the reference marker M1 It also shows the bandwidth between the n dB down markers You can then adjust the distance of the temporary markers M Press the Marker Function softkey M Select ...

Page 123: ...r the R S FSH automatically turns off the noise marker or the frequency counter Defining the demodulation time period M Press the MARKER key M Press the Marker Function softkey M Select the Time menu item The R S FSH opens an input field to define the demodulation time M Enter the demodulation time you need The range is from 100 ms to 500 s In time domain the R S FSH demodulates continuously i e t...

Page 124: ...al position of the line M Enter the level value you need The R S FSH positions the display line accordingly Alternatively you can also move the display line with the rotary knob or the cursor keys 2 2 8 Using Limit Lines Limit lines help you to identify if a signal complies with certain level characteristics A limit line is made up out of two or more points that are connected to a line Each of the...

Page 125: ...al is above the limit line In case of lower limit lines the R S FSH checks if the signal is below the limit line You also have to make sure that the limit line is compatible to the scale of the horizontal axis M Press the LINES key M Depending on the application press the Upper Limit or Lower Limit softkey The R S FSH opens a dialog box to select the limit line M Select the Load From File menu ite...

Page 126: ...ing Limit Checks If limit lines are active the R S FSH automatically checks the trace for limit violations after each frequency sweep As long as the signal does not violate the limit line the R S FSH shows a Pass message in the measurement diagram As soon as one single value i e one pixel is outside of the limits the R S FSH displays a Fail message in the diagram area and in addition sounds a beep...

Page 127: ...After activating the channel table the R S FSH is set up according to the information contained in the channel table Instead of a center frequency the R S FSH shows the currently active channel number including the name of the channel The center frequency of a channel is defined in the channel table and is the frequency corresponding to the selected channel Selecting a channel Entering a center st...

Page 128: ...lation between the values is performed with the aid of a modified spline algorithm Even if only relatively few values such as maxima minima and turning points are available this algorithm can easily simulate the correction factors of common transducers Two transducers can be switched on at a time The second transducer must be assigned the unit dB The R S FSH adds the two transducers to a total tra...

Page 129: ...ive unit dB as otherwise an addition would not be useful When you select a secondary transducer factor the dialog box shows only those transducer factors that have dB as their unit 2 4 1 Unit for Measurements with Transducers If the unit of the transducer is dB the units dBm dBmV or dBYV remain unchanged The linear units Volt and Watt are not permissible They are deactivated in the units menu If t...

Page 130: ...mes the transducer values outside the defined range to be zero 2 4 4 Data Sets Containing Transducer Factors The R S FSH stores data sets together with any transducer factors that may have been active for the measurement in question When such a dataset is recalled the associated transducer factor s are switched on as well Transducer factors recalled as part of a data set do however not appear in t...

Page 131: ...SH Z18 power sensor port C R S NRP Z11 USB C R S NRP Z21 USB C R S NRP Z22 USB C R S NRP Z23 USB C R S NRP Z24 USB C R S NRP Z31 USB C R S NRP Z51 USB C R S NRP Z55 USB C R S NRP Z56 USB C R S NRP Z57 USB C R S NRP Z81 USB C R S NRP Z91 USB C R S NRP Z92 USB If you are using one of the NRP power sensors you also need a passive USB adapter R S NRP Z4 to connect the power sensor to the R S FSH For m...

Page 132: ...also connect a power sensor via the USB interface on the right If you are using the R S FSH Z1 and Z18 power sensors connect the power sensor cable to the power sensor interface and screw it into position Power sensors of the R S NRP product line are controlled via the USB interface with a passive USB adapter After connecting the power sensor to the R S FSH you can connect the DUT to the N connect...

Page 133: ... Communication error between the R S FSH and the power sensor Unscrew the sensor from the R S FSH and check the connectors If the problem persists contact a Rohde Schwarz service center Power sensor error The power sensor signals an error to the R S FSH Contact a Rohde Schwarz service center Unknown power sensor model connected TheR S FSH cannot identify the device connected to the power sensor in...

Page 134: ...ntinue softkey to start zeroing M Press Cancel to abort zeroing for example if you cannot disconnect the signal source The R S FSH immediately starts power sensor zeroing While zeroing is in progress the R S FSH shows the message Zeroing power sensor please wait When zeroing is over the R S FSH shows the message and switches back to the softkey menu for the power sensor Selecting the unit for the ...

Page 135: ...stability of results for signals with low levels or modulated signals C A long measurement time is appropriate for signals with very low power levels 50 dBm To eliminate noise and the effects of noise on the measurement effectively use the R S FSH Z1 power sensor M Press the Meas Time softkey M Select the measurement time most suitable for your test setup Taking additional loss or gain into accoun...

Page 136: ...source reverse power The ratio of forward and reverse power is a measure of the load matching The R S FSH displays the results as the return loss or the standing wave ratio M Press the MODE key M Press the Power Meter softkey The R S FSH activates the mode for power measurements Screen layout of the power meter mode with a directional power sensor 1 Connected power sensor model 2 Selected transmis...

Page 137: ...t setup in such a way that the Forward arrow 1 2 on the sensor points toward the load in the direction of the power flux If the R S FSH recognizes a power sensor it sets up a connection via the interface and after a few seconds shows the results It displays the type of the power sensor in the display header If an error occurs the R S FSH shows a corresponding message For more information see Conne...

Page 138: ... in another operating mode In that case it uses that frequency as the power sensor frequency If you want to perform measurements on another known signal you can change the power sensor frequency manually M Press the MEAS key M Press the Freq softkey An input field to define the frequency opens M Enter the frequency of the signal The R S FSH transfers the new frequency to the power sensor which the...

Page 139: ...lues into account for a number of common telecommunications standards M Press the Standard softkey A menu to select a standard opens M Select the required standard The R S FSH takes the selected standard into account The currently active standard is displayed in the display header Taking additional attenuation into account When the directional power sensor is connected to a test point not directly...

Page 140: ...ses the coupling attenuation of the directional coupler or the attenuation value of the attenuator are to be entered as positive dB values see above into the R S FSH to ensure true measured power readout In both cases a termination or an attenuator of sufficient power handling capacity has to be connected to the power sensor at the load end The matching readout is irrelevant in such case since it ...

Page 141: ...agnitude for these kinds of measurements and make results even more accurate If the R S FSH also has an internal VSWR bridge models 24 28 the R S FSH can also determine the reflection on either port or the forward transmission characteristics The VSWR bridge enables the R S FSH to switch the tracking generator to each of the measurement ports ports 1 and 2 and can therefore send signals from port ...

Page 142: ...t an attenuation of 40 dB the output level is 40 dBm Screen layout of the network analyzer 1 Result display 2 Measurement mode 3 0 dB reference 4 Status line S matrix Calibration status Measurement format 5 Trace window 6 Network analyzer softkey menu 4 1 Calibrating Measurements In its default state the R S FSH uses factory calibration Factory calibration is a full 2 port calibration over the cur...

Page 143: ...dge Calibration remains valid after turning off the R S FSH or changing into another operating mode as calibration data is saved in the internal memory of the R S FSH If you save the measurement setup in a data set calibration data is part of that data set 4 1 1 1 Calibration States The R S FSH features several calibration states It displays the current state in the status line The possible states...

Page 144: ... been calibrated for has changed compared to those that have been in use during calibration This could result in an increasing measurement uncertainty When calibration has become invalid for any reason or the calibration data has changed you can restore the most recent calibration that was valid M Press the Calibration softkey M Select the Restore Calibration Settings menu item The R S FSH restore...

Page 145: ...taken into account more accurately and correction data is applied in both directions forward and reverse This method provides even more accurate results than the normal full 2 port calibration but takes a while longer to finish C Reflection Port 1 2 Test port 1 or 2 is calibrated for reflection measurements on that port S11 or S22 The calibration routine requires the calibration standards open sho...

Page 146: ... For more information see Selecting a calibration kit on page 128 M Else press the Continue softkey The R S FSH asks you to connect an Open first to port 1 then to port 2 M Firmly connect the Open of the calibration standard to the ports M You can abort the calibration any time by pressing the Cancel softkey M Press the Continue softkey to start calibration The R S FSH calibrates the open M Discon...

Page 147: ...eady part of the R S FSH firmware You can create and edit calibration kits with the R S FSH4View software and transfer them to the R S FSH via the USB or the LAN interface The number of standards the R S FSH can store in its memory depends on the number of other data sets stored on the R S FSH For more information see Saving and Loading Instrument Settings and Measurement Results on page 213 M Pre...

Page 148: ...measurements 4 2 Performing Scalar Measurements With scalar measurements you can measure the magnitude of both reflection and transmission characteristics of a device under test To calibrate the measurements only normalization is available 4 2 1 Measuring the Transmission The example included here is based on a transmission measurement of a two port filter The filter has a center frequency of 2060...

Page 149: ...FSH opens an input field to define the span M Enter a span of 50 MHz to get a high resolution of the results Calibrate the measurement for scalar transmission measurements Scalar measurements provide normalization only Normalization is not as accurate as a full calibration but yields pretty accurate results nonetheless In addition normalization needs one calibration standard only and therefore is ...

Page 150: ...y M Press the Meas Mode softkey M Select the Scalar menu item Select the type of reflection measurement M Press the Result Display softkey M Select the Reflection Port 1 menu item for reflection measurements on port 1 or the Reflection Port 2 menu item for reflection measurements on port 2 Define the frequency parameters Before calibrating the measurement you should define the frequency parameters...

Page 151: ...her dynamic range and accuracy because of the advanced calibration methods that vector measurements provide In addition to normalization vector measurements feature full calibration methods that require a 50 termination in addition to an open or short circuit Instead of the characteristics of the VSWR bridge the decisive factor of the quality of results is the quality of the calibration standards ...

Page 152: ...the PRESET key M Connect the DUT Start vector measurements M Press the MEAS key M Press the Meas Mode softkey M Select the Vector menu item Select the type of transmission measurement M Press the Result Display softkey M Select the Transmission Fwd Port 1 2 menu item for transmission measurements in forward direction or Transmission Rev Port 1 2 menu item for transmission measurements in reverse d...

Page 153: ...phase characteristics without affecting the accuracy of the measurement For more information see Selecting the Measurement Format on page 136 Note that for calibration to remain valid frequency parameters bandwidth and attenuation have to remain the same Depending on the calibration method you can also select other result displays e g reflection measurements without having to recalibrate the R S F...

Page 154: ... The R S FSH opens an input field to define the span M Enter a span of 130 MHz to get a high resolution of the results Calibrate the measurement for vector reflection measurements Vector measurements provide the full range of calibration methods for more accurate results Most full calibration methods require more than one calibration standard M Press the Calibration softkey M Select the appropriat...

Page 155: ...r reflection in dB The diagram is a Cartesian diagram with a logarithmic vertical axis The horizontal axis represents the measured frequency range The magnitude format is the default format for all measurements Available for all measurements Phase Shows the phase characteristics of the DUT in degrees The diagram is a Cartesian diagram with a linear vertical axis The horizontal axis represents the ...

Page 156: ... AMPT key M Press the Unit softkey Available for vector reflection measurements Smith chart Shows the measurement results in the Smith chart The Smith chart is a circular diagram that primarily shows impedance or reflection characteristics of a DUT Available for vector reflection measurements For more information see Working with the Smith Chart on page 138 Cable loss Shows the cable loss characte...

Page 157: ...Ts in which phase delay and group delay match C Due to the significantly wider aperture the measurement certainty is an order of magnitude higher in the phase delay measurement than in the group delay measurement The result for the electrical length is correct only if the phase difference between two adjacent test points does not exceed 180 Available for vector measurements Delay time Shows the de...

Page 158: ...nt The R S FSH adjusts the size of the rectangle By default the position of the rectangle is the area in the center of the display You can also change the position of the rectangle The magnitude of the shift is a percentage and ranges from 50 to 50 for both vertical and horizontal directions The zero point 0 in vertical and horizontal direction is the center of the Smith diagram M Press the Move X...

Page 159: ... position C Real Imag Rho Shows the real and imaginary components at the current marker position C R jX Shows the real and imaginary components of the impedance at the marker position The imaginary component is converted to inductance or capacitance Marker frequency and sign are taken into account C G jB Shows the real and imaginary components of the admittance at the marker position The imaginary...

Page 160: ...lue range is from 1 m to 10 k 4 4 1 2 Working with the Dual Trace Mode When performing vector measurements it is possible to perform and display two measurements simultaneously After activating this function the R S FSH shows the two traces on two separate screens This allows you to view any combination of two vector measurement formats on the display Note that the Magnitude Phase measurement form...

Page 161: ...n trace 1 and 2 The trace indicator shows the currently active trace After selecting trace 2 you can set the measurement parameters for trace 2 while the first trace is passive You can also use the trace memory using the Show softkey in the Trace menu Restoring a saved trace is possible only for the currently active trace i e screen 1 or screen 2 For more information see Working with Memory Traces...

Page 162: ...op of the diagram the risk of an overload is eliminated M Press the AMPT key M Press the Ref softkey The R S FSH opens an input field M Enter the reference value you need to see the trace completely The R S FSH moves the trace accordingly relabels the vertical axis and shows the new 0 dB reference in the hardware settings display Changing the reference position Changing the reference position move...

Page 163: ...ge softkey M Select the display range you need from the submenu The R S FSH adjusts the vertical axis accordingly Automatic scaling of the vertical axis All measurement formats except the Smith chart feature an automatic scale function If you use automatic scaling the R S FSH automatically sets the display range in a way that the trace best fits on the display M In the Range submenu select the Aut...

Page 164: ...elecommunications standards that are not listed you can also build channel tables manually with the Channel Table Editor of the R S FSH4View software package that is delivered with the R S FSH To use one of those you just have to copy the channel table to the R S FSH 4 4 5 Using Limit Lines When working with the magnitude format in the network analyzer you can use limit lines to set limits for lev...

Page 165: ...gle frequency Typical applications for a vector voltmeter are C adjustment of the electrical length of cables with a reflection measurement C testing of the antenna elements of a phase controlled antenna array relative to a reference antenna with a transmission measurement M Press the MODE key M Press the Network Analyzer softkey M Press the MEAS key M Press the Meas Mode softkey M Select the Vect...

Page 166: ...n page 123 4 5 2 Performing Measurements With the vector voltmeter you can measure the reflection on port 1 and the transmission in reverse direction The example included here is based on a transmission measurement of a two port filter The filter works in the frequency from of 1920 MHz to 1980 MHz Select the type of reflection measurement M Press the Result Display softkey M Select the Reflection ...

Page 167: ...e or format see Selecting the Measurement Format without affecting the accuracy of the measurement 4 5 2 2 Performing Reflection Measurements Calibrate the measurement for reflection measurements M Press the Calibration softkey M Select the Reflection Port 1 menu item M Perform calibration For more information see Performing Calibration M Reconnect the DUT The R S FSH shows the characteristics of ...

Page 168: ...ifferent DUTs whose results you d like to compare you can save the current results as reference values M Press the MEAS key M Press the Ref softkey The R S FSH saves the results that it got prior to pressing the softkey as the reference result for future measurements The results show the difference of the current measurement and the reference measurement The unit for reference measurements is alwa...

Page 169: ... system equipment for its characteristics and identify faults when it is being installed or maintained C Reflection Measurements on page 152 C Distance to Fault Measurements on page 153 C Spectrum Measurements on page 154 Test setup A typical test setup to test cables and antennas includes the R S FSH an RF cable e g R S FSH Z320 order no 1309 6600 00 a calibration standard R S FSH Z28 or R S FSH ...

Page 170: ...ws M Press the MODE key M Press the Distance to Fault softkey The R S FSH starts the DTF mode By default the R S FSH performs measurements on port 1 It however also supports measurements on port 2 but you have to configure those first M Press the Meas Mode softkey M Select the DTF Refl Measurement Port menu item The R S FSH opens a submenu M Select either Port 1 or Port 2 Screen layout of the cabl...

Page 171: ...dB in a specified frequency range M Press the Meas Mode softkey M Select the Reflection menu item The R S FSH starts the reflection measurement over its entire frequency range The figure below shows an example of a reflection measurement without any major faults in the cable or the antenna You can perform reflection measurements on the complete system or on individual components of the system If y...

Page 172: ...ence signal created by the tracking generator It then performs inverse fast fourier transformation IFFT on the signal that has been received In combination with the characteristics of the cable model the R S FSH is able to determine the distance the reflections have been travelling Because of its sensitivity by first measuring in the frequency domain and subsequent IFFT the measurement is able to ...

Page 173: ...ault format It shows the magnitude of the results in dB C VSWR The VSWR shows the standing wave ratio in a cartesian diagram The VSWR is the ratio of the maximum voltage and the minimum voltage that occur in an electrical transmission line The VSWR format is available for DTF and reflection measurements C Reflection Coeffcient Shows the reflection coefficient of the DUT The reflection coefficient ...

Page 174: ...as for the network analyzer For more information see Calibration States on page 124 5 1 5 2 Calibration Methods In distance to fault mode the calibration method is a full 1 port calibration For more information see Calibration Methods on page 125 5 1 5 3 Performing a Full 2 Port Calibration For a description of a complete calibration procedure see Performing Calibration on page 127 5 2 Configuring...

Page 175: ...l with the Cable Model Editor that is part of the R S FSH4View software package The R S FSH4View is delivered with the R S FSH With this software you can define a cable model on a PC and then transfer it to the R S FSH Then you can select it just like any other predefined cable model For more information see C Saving and Loading Instrument Settings and Measurement Results If you do not have access...

Page 176: ...a DTF List The DTF list shows the results of the distance to fault measurement in numerical form M Press the MEAS key M Press the DTF Settings softkey M Press the DTF List softkey The R S FSH opens a table that lists the peaks it has found during the measurement The table contains the following information C Peak Shows the peak the results refer to C Distance Shows the distance from the measuremen...

Page 177: ...lates the best span Auto Span for the best length resolution If the required span is too large for the current center frequency the R S FSH sets the center frequency to the smallest possible frequency M Enter the span you need manually The R S FSH sets the new span Note that the maximum span you can set depends on the maximum cable distance you have defined and is never greater than the span calcu...

Page 178: ...ength the R S FSH does not display the faults of the whole cable A reflection at the end of the cable will not be shown However deliberately entering a cable length that is too short is a good way to increase measurement accuracy for a fault that is near to the measurement plane If the entered cable length is greater than the actual length the results for lengths beyond the actual cable length are...

Page 179: ...djusts the labels of the vertical axis Changing the reference value changes the vertical position of the trace It does not change the position of the reference line M Press the AMPT key M Press the Ref softkey M Enter the reference value you want or move the reference with the rotary knob The R S FSH sets up the display accordingly Defining the display range The display range defines the scale of ...

Page 180: ... to the top grid line and 10 corresponds to the bottom grid line When you change the reference position the R S FSH also shifts the position of the trace by the magnitude of the reference position change It has no effect on the reference value itself M Press the AMPT key M Press the Ref Pos softkey M Enter the reference position you want The R S FSH moves the trace accordingly 5 2 3 2 Setting the ...

Page 181: ...or delta markers Markers work the same way as in spectrum mode For more information see Using Markers on page 96 5 2 5 Using Display and Limit Lines The display and limit line functionality in CAT mode is the same as that of the spectrum analyzer mode For more information on using the display line see Using Display Lines on page 105 For more information on using limit lines see Using Limit Lines o...

Page 182: ... the Receiver Mode softkey The R S FSH starts the receiver mode in single frequency measurement mode 6 1 Selecting the Measurement Mode In receiver mode the R S FSH features two measurement modes C Fixed Frequency Channel C Frequency Scan Channel Scan Fixed measurement mode is designed for measurements on single frequencies Scan measurement mode performs scans on a defined set of frequencies 6 1 1...

Page 183: ... on the R S FSH model you are using M Press the FREQ key M Press the Freq softkey Enter the frequency you want to measure For a quick change of frequencies with the rotary knob define a frequency stepsize M Press the Freq Stepsize softkey Enter a frequency stepsize For measurements on systems that use channels instead of single frequencies you can also load a channel table and measure the channel ...

Page 184: ...ugh so that the signal does not disappear in the inherent noise M Press the AMPT key M Press the Ref Level softkey Define the reference level that best fits the measurement In the default state the reference level corresponds to the level at the right of the bargraph The reference level position is shown by a triangle in the bargraph scale label You can move the reference position to another posit...

Page 185: ...ency spectrum covered by the scan The vertical axis represents the power levels The power levels for each frequency contained in the scan are represented by a horizontal line at the receive frequencies that have been measured This type of display emphasizes the fact that the scan measures single receive frequencies only and not the frequencies between those receive frequencies M Press the MEAS key...

Page 186: ...the scan to start at M Press the Scan Stop softkey Enter the frequency you want the scan to stop at M Press the Scan Step softkey Enter the step size you want to apply The R S FSH starts the scan as soon as you have finished defining the scan range Performing a channel scan Instead of a frequency scan you can also perform a channel scan A channel scan is based on the contents of a channel table In...

Page 187: ...he maximum power of the signal that was measured during the measurement time C Average If the average detector is active the R S FSH calculates and displays the linear average power of the signal that was measured during the measurement time C RMS If the RMS detector is active the R S FSH calculates and displays the RMS power of the signal that was measured during the measurement time C Quasi Peak...

Page 188: ...t Bandwidths for EMI Measurements The receiver mode adds 6 dB resolution bandwidths to the 3 dB resolution bandwidths already available in other operating modes The 6 dB bandwidths are special bandwidths that are necessary for measurements according to CISPR16 If automatic selection of the CISPR bandwidth is on or when you use the quasi peak detector the R S FSH selects an appropriate CISPR bandwi...

Page 189: ...res the receive frequency or set of frequencies over the measurement time you have defined If you want to perform a single measurement or scan only select single scan mode M Press the SWEEP key M Press the Single Scan softkey to perform a single scan or measurement M Press the Cont Scan softkey to perform a continuous scan or measurement When you select single scan mode the R S FSH performs the me...

Page 190: ...ation tests For some options there is also an extended version that features additional functionality like graphic results General Settings of the Digital Modulation Analyzer The result summary includes some basic settings of the analyzer The contents are similar to those of the Hardware Settings in the spectrum analyzer Most of these settings are available for every application This chapter provi...

Page 191: ...applies especially for measurements with more than one active channel near the one you are trying to measure 6 MHz Note that the signal level at the A D converter may be stronger than the level the R S FSH displays depending on the current resolution bandwidth This is because the resolution bandwidths are implemented digitally after the A D converter In case of an IF overload the R S FSH shows a c...

Page 192: ...lecting the Sweep Mode on page 88 Sync Not Found Sync OK Indicates whether synchronization was successful or not To successfully synchronize the R S FSH to the signal you have to enter the correct values for center frequency reference level or in case of for example a WCDMA signal the correct scrambling code To indicate successful synchronization the R S FSH shows the label If the synchronization ...

Page 193: ...ows the results of the signal and its surrounding frequencies Thus you should use this result display for situations when measurement speed is an issue not accuracy While using the spectrum overview you can only set the resolution bandwidth and the span M Press the Result Display softkey M Select the Spectrum Overview menu item The Isotropic Antenna Result Display The isotropic antenna result disp...

Page 194: ...een If the results violate one of the limits the limit check has failed The results are highlighted red A complete limit check usually consists of the limit definition of several results The complete limit check only passes if every individual limit check also passed In that case the R S FSH shows LIMITS PASSED in the result display If even one limit has failed the R S FSH shows LIMITS FAILED By d...

Page 195: ...asurements on slot level include the power level error vector magnitude EVM the code domain error and the frequency error To get sufficient measurement accuracy it is necessary to synchronize the reference frequency of the base station and the R S FSH via the EXT REF IN input In addition you can analyze the following channel types in more detail C Common Pilot Channel CPICH Note This channel is re...

Page 196: ...gs 4 Global results 5 Channel results 6 Synchronization state green font synchronization OK red font synchronization failed 7 3GPP WCDMA softkey menu 7 2 1 1 General Settings For more information see General Settings of the Digital Modulation Analyzer on page 171 In addition the application features some settings specific to the 3GPP standard For more information on each type of parameter see Conf...

Page 197: ...e than 1 kHz the R S FSH is not able to synchronize with the signal If possible you should synchronize the receiver and the transmitter I Q Offset Shows the DC offset of the signal in This value is valid only after performing a channel search I Q Imbalance Shows the I Q Imbalance of the signal in This value is valid only after performing a channel search Composite EVM Shows the Error Vector Magnit...

Page 198: ...a channel search 7 2 1 3 Channel Results Channel results contain various results that are specific to one or more channels P CPICH Power Shows the power of the P CPICH in dBm P CPICH Ec Io Shows the ratio of the power of the pilot channel to the total power of the signal Therefore this value shows the usable part of the signal P CPICH Symbol EVM rms Shows the averaged root mean square EVM on symbo...

Page 199: ...shows if it is the absolute power or the power in relation to the pilot channel P CPICH 7 2 2 The Code Domain Analyzer If you equip the R S FSH with option R S FSH K44E code domain analysis becomes available to visualize the results in a diagram M Press the Result Display softkey M Select the Code Domain Power menu item The R S FSH starts the code domain analyzer Screen layout of the code domain p...

Page 200: ... see Selecting the Trace Mode on page 91 7 2 2 2 Diagram Header The diagram header shows the results for individual code channels Code channel Shows the number of the code channel the results are displayed for For more information see Selecting the Slot and Code Channel on page 185 Slot Shows the slot number For more information see Selecting the Slot and Code Channel on page 185 Symbol rate Shows...

Page 201: ... of the channel it belongs to C Yellow active code channels C Turquoise inactive code channels C Red currently selected code channel The power of the codes is a relative value The reference power is the power of the pilot channel You can also display the absolute powers of the code channels For more information see Changing the Code Power on page 186 7 2 3 The Code Domain Channel Table If you equi...

Page 202: ... Channel Power Shows the power of the complete signal Active Channels Shows the number of the currently measured channels 7 2 3 3 Channel Table The channel table is made up out of seven columns that show various information about each channel The number of rows depends on the number of channels that are currently active If a channel occupies more than one code the results correspond to all codes i...

Page 203: ...fying the Scrambling Code To demodulate a 3GPP signal you have to know the primary and secondary scrambling codes of the base station you are testing You can enter the scrambling code manually or let the R S FSH automatically find the right scrambling code s Defining the scrambling code manually M Press the MEAS key M Press the Signal Settings softkey M Select the Primary Code or Secondary Code me...

Page 204: ...els CPICH belonging to the scrambling code You can see the power in numerical form in a table above the diagram area and in graphical form 7 2 4 2 Setting the Antenna Diversity By default the R S FSH does measurements on base stations with one antenna For base stations with two antennas you have to specify the antenna to synchronize to M Press the MEAS key M Press the Signal Settings softkey M Sel...

Page 205: ...correspond to the channel not the one code 7 2 4 4 Changing the Code Power By default the application displays the absolute power of all code channels Alternatively you can display the power relative to the P CPICH M Press the MEAS key M Press the Power Settings softkey M Select the Relative to CPICH menu item All power display now relate to the pilot channel 7 2 4 5 Performing Fast Measurements F...

Page 206: ...inity of the PN offset you have entered If you are using the automatic PN Offset the R S FSH performs a full search for the PN offset and reports the PN found In a free run situation the R S FSH searches for the start of the PN sequence over the entire signal length The R S FSH performs various general measurements over one PCG power control group as well as measurements on specific channels It th...

Page 207: ...pplication features some settings specific to the 3GPP standard PN Offset Shows the current Pseudo Noise PN Offset of the base station For more information see Changing the PN Offset on page 196 The PN Offset only takes effect in combination with an external or GPS trigger Trigger Shows the current trigger mode For more information see Working with Trigger Functionality on page 88 In addition to t...

Page 208: ...ows the composite Error Vector Magnitude EVM in The EVM is the root of the ratio of the mean error power root mean square to the power of an ideally generated reference signal An EVM of 0 means a perfect signal Carrier Frequency Error Shows the frequency error in relation to the current center frequency of the R S FSH For more information see Selecting the Unit of the Carrier Frequency Error on pa...

Page 209: ...H and the synchronization channel SYNC The pilot channel always occupies code 0 and the synchronization channel always occupies code number 32 7 3 2 The Code Domain Analyzer If you equip the R S FSH with option R S FSH K46E code domain analysis becomes available to visualize the results in a diagram M Press the Result Display softkey M Select the Code Domain Power menu item The R S FSH starts the ...

Page 210: ...nnel in relation to the pilot channel or the RF channel power The numbers in the C x element and the walsh code Ch SF depend on the currently selected channel For more information see Changing the Reference Power on page 195 7 3 2 2 Diagram Area The Code Domain Power result display contains the measurement results in graphic form It shows the power of all codes in the signal In the graph each bar ...

Page 211: ...2 Currently selected standard 3 Header table 4 Synchronization state and GPS information green font synchronization OK red font synchronization failed 5 Channel table 6 CDMA2000 softkey menu 7 3 3 1 Header Table The header table contains various settings already discussed in the sections above For more information see The Result Summary on page 187 7 3 3 2 Global Results The global results contain...

Page 212: ...2000 Standard nine RCs are defined in the forward link Status Status display Unassigned codes are identified as inactive channels Power Abs dBm Absolute power of the channel in dBm Power Rel to PICH Total dB Relative power of the channel in dB The reference channel is the PICH or the total signal depending on the reference power you have selected 7 3 4 The PN Scanner If you equip the R S FSH with ...

Page 213: ... display the number of displayed codes changes accordingly Take care of setting the base spreading factor of the code domain to either 64 or 128 If you set the base spreading factor to 64 for channels with a base spreading factor of 128 code class 7 an alias power may be displayed in the Code Domain Power result display because of the ambiguity of the Hadamard Matrix An alias power is a displayed ...

Page 214: ...ttings softkey M Select either the Code Power Relative To Pilot or Code Power Relative To Total menu item By default the R S FSH displays the power in the unit dBm 7 3 5 4 Selecting the Unit of the Carrier Frequency Error The absolute frequency error is the sum of the frequency error of the R S FSH and that of the device under test If the frequency error is more than 1 kHz the R S FSH is not able ...

Page 215: ...orming measurements on a base station you can synchronize the sweep via the GPS receiver M Press the SWEEP key M Press the Trigger softkey M Select GPS Sync menu item The R S FSH now synchronizes the sweep to the signal using the GPS receiver 7 4 Measurements on 1xEV DO Signals Equipped with the software application R S FSH K47 you can perform measurements on downlink 1xEV DO signals in accordance...

Page 216: ... The Result Summary The result summary shows various measurement results and hardware settings in numerical form M Press the Result Display softkey M Select the Result Summary menu item The R S FSH shows the numerical results in a table 1 Current type of result display 2 Currently selected standard 3 General settings 4 Synchronization state and GPS information green font synchronization OK red fon...

Page 217: ...al These results evaluate the total signal over the period of one frame Global results also contain information about the queliaty of the composite signal Channel Power Total power of the signal in dBm in the 1 23 MHz bandwidth around the center frequency Carrier Frequency Error Shows the frequency error in relation to the current center frequency of the R S FSH For more information see Selecting ...

Page 218: ... root mean square to the power of an ideal reference signal An EVM of 0 means a perfect signal Rho Quality parameter Rho of the pilot channel Rho is specified in the CDMA2000 standard It is the normalized correlated power between the measured signal and an ideal reference signal The standard requires that only the pilot channel is measured to get the results for Rho 7 4 2 The PN Scanner If you equ...

Page 219: ...re than 1 kHz the R S FSH is not able to synchronize with the signal If possible you should synchronize the receiver and the transmitter The carrier frequency error can have the unit Hz or ppm M Press the MEAS key M Press the Display Settings softkey M Select the Hz or ppm menu item The R S FSH shows the carrier frequency error in the unit you have selected 7 4 4 2 Changing the PN Offset The stand...

Page 220: ... R S FSH K50 and R S FSH K51 you can perform measurements on downlink LTE FDD R S FSH K50 and TDD R S FSH K51 signals in accordance to the 3GPP standard with your R S FSH Bandwidth of LTE signals Because of the bandwidth of LTE signals measurements are possible only with instruments that support a bandwidth of 20 MHz serial numbers 105000 and higher M Press the MODE key M Press the Dig Mod Analyze...

Page 221: ...d 5 Global results 6 Allocation summary or reference signal overview 7 CDMA2000 softkey menu 7 5 1 1 General Settings For more information see General Settings of the Digital Modulation Analyzer on page 171 In addition the application features some settings specific to the 3GPP standard Ch BW Shows the current base channel bandwidth and number of resource blocks RB For more information see Selecti...

Page 222: ...sweep 7 5 1 2 Global Results Global results contain various measurement results of the composite signal These results evaluate the total signal over the period of one frame The global results also contain information about the quality of the measured signal of up to one frame The exact amount of data that is analyzed depends on the number of selected subframes RF Channel Power Shows the total powe...

Page 223: ...Cell Identity on page 209 Cyclic Prefix Shows the cyclic prefix the current results correspond to For more information see Selecting the Cyclic Prefix on page 209 Traffic Activity Percentage of traffic slots with data I Q Offset Shows the power at spectral line 0 normalized to the total transmitted power The I Q offset may be an indicator for a baseband DC offset or for carrier leakage 7 5 1 3 All...

Page 224: ...ains the power and EVM for each antenna The number of results depends on the number of antennas you are measuring 1 2 or 4 The power values are normalized to one resource element or one subcarrier respectively The R S FSH evaluates the results over all resource blocks and subframes If you know the cell ID you can synchronize the R S FSH with the reference signal Synchronizing with the reference si...

Page 225: ...ns In that case the R S FSH distinguishes modulation schemes used in the transmission of data channels by using different colors C QPSK modulation C 16QAM modulation C 64QAM modulation For easy identification of the pilot synchronization and control channels in the diagram the R S FSH also uses different colors C PSYNC C SSYNC C Control channels with QPSK modulation In addition to an overview of a...

Page 226: ...pe of result display 2 Currently selected standard 3 Color map 4 Diagram area 5 General signal information 6 LTE softkey menu The resource allocations result display shows the power of each resource element in the signal Each row of the diagram corresponds to a resource block The columns represent a subframe each The resource allocation is thus a good way to measure the amount of traffic currently...

Page 227: ...hold is the minimum or maximum signal level that is included in the color map The application also allows you to select the color scheme M Press the Display Settings softkey M Select the Color Table menu item The R S FSH opens a submenu M Select the color scheme you want 7 5 4 Configuring the Measurement Some of the results depend on the measurement configuration 7 5 4 1 Selecting the Channel Band...

Page 228: ...in 168 cell identity groups with 3 unique identities per group In the default state the R S FSH automatically detects the cell identity its group and ID If you need results for a specific identity you can also select it manually Setting the cell ID M Press the MEAS key M Press the Signal Settings softkey M Select the Cell Identity menu item The R S FSH opens an input field to define the cell ident...

Page 229: ... selects the way the R S FSH synchronizes to the LTE signal By default the R S FSH automatically determines the type of synchronization signal to use Alternatively you can select the synchroniztaion signal manually You can either synchronize to the PSYNC or SSYNC signals or synchronize to the reference signal M Press the Signal Settings softkey M Select the PSYNC SSYNC menu item The R S FSH synchr...

Page 230: ...ted 7 5 4 8 Configuring EVM Results In case of the EVM you can define the unit of the EVM and EVM calculation method To obtain EVM values according to standard the channel estimation and EVM windowing methods defined in 3GPP TS 36 141 are used Prerequisites for a standard compliant measurement are signals according to the enhanced test models defined in 36 141 and an external frequency reference d...

Page 231: ...perating Manual 1309 6275 12 14 212 Displaying the EVM according to standard M Press the MEAS key M Press the Meas Settings softkey M Select the EVM According to Standard menu item If the R S FSH displays the EVM according to standard the menu item is marked by an X ...

Page 232: ... internal memory The size of a dataset depends on the contents On average the internal memory provides space for about 100 datasets including limit lines transducer factors telecommunictions standards or cable models If you need more datasets you can also store the datasets on an SD card or memory stick via the USB interface models with serial number 105000 and higher The R S FSH4View software pac...

Page 233: ...e the data to M Select the folder you want to save the data to M Enter a file name in the corresponding input field The default file name for datasets is Dataset set with a new number in ascending order for each new dataset The file extension for datasets is set If you enter another name the R S FSH uses that name and assigns a new number to the file name if you save the data set the next time Thi...

Page 234: ... want to add with the cursor keys M Press ENTER to add the term to the file name The current file name is displayed in the line above the table So if you perform for example an ACLR measurement of an uplink LTE signal at a certain location you might want that information in the file name Site_LTE_UL_ACLR M Press the OK softkey to exit the quick naming table After you have exited the table the file...

Page 235: ...into the internal memory of the R S FSH M In the Quick Naming softkey menu press the Import softkey M Select the Import Quick Naming Table menu item The R S FSH opens a dialog box to select a file to import The same way you can also export a quick naming table M In the Quick Naming softkey menu press the Export softkey M Select the Export Quick Naming Table menu item 8 3 Loading Measurement Result...

Page 236: ...ment task you can load it M Press the Activate softkey The R S FSH loads the dataset in question and adjusts its measurement settings to those of the dataset 8 3 3 Quick Recall of Instrument Settings For regular measurement tasks the R S FSH allows quick access to previously saved datasets by linking a particular dataset to one of the softkeys Assigning a dataset to one of the softkeys M Press the...

Page 237: ...the settings made in the User Preference Setup menu The R S FSH immediately activates the dataset assigned to that softkey 8 4 Compiling a Measurement Report The R S FSH4View software provides functionality to evaluate results and compile measurement reports However before you can start to evaluate the results you have to download the results to your computer M Select the Wizard Result Control fun...

Page 238: ...ing the measurement M Add the results you want to include in the report by setting a checkmark or removing the checkmark in the report pane M Select the report format you would like M Create the report with the Save button 8 5 Deleting Datasets If you have to delete a dataset you can do so with the file manager M Press the SAVE RECALL key M Press the File Manager softkey The R S FSH opens the file...

Page 239: ...at the selection by moving the cursor with the rotary knob or the cursor key and marking more data sets with the ENTER key M Press the Select Action softkey M Select the Delete menu item and confirm with the ENTER key or the Select Action softkey Before deleting the data set the R S FSH shows a warning message that you need to confirm After confirming the deletion process the R S FSH deletes the s...

Page 240: ...ve a square wave with a certain on off ratio or a sawtooth wave However detecting superimposed low level signals or monitoring the harmonic content of the signal is easier with a spectrum or signal analyzer Figure 9 1 shows the theoretical basis of the two measurement methods In the time domain an oscilloscope would for example show a section of the signal that is a square wave The same signal whe...

Page 241: ...ly shows the mixing process For models with a frequency limit of 3 6 GHz models 04 14 24 the IFs are 4892 8 MHz 860 8 MHz and 54 4 MHz The conversion from a specific input frequency to the first IF is done by a local oscillator LO This LO can be tuned from 4 8 GHz to 8 4 GHz All other conversions are handled by single frequency oscillators In case of models with a frequency limit of 8 GHz models 0...

Page 242: ...s closer together than the bandwidth of the IF filter cannot be resolved This is why the bandwidth of the IF filter in a spectrum analyzer is referred to as the resolution bandwidth The R S FSH has resolution bandwidths from 1 Hz to 3 MHz The bandlimited IF is passed to the envelope detector The envelope detector removes the IF from the signal and outputs its envelope The output signal from the en...

Page 243: ...hile the sine signal to be measured DC is not affected The figures below show a weak sine signal In the first picture it is measured with a large video bandwidth and in the second with a narrow video bandwidth Limiting the video bandwidth smoothes the trace considerably This makes it much easier to determine the level of the measured signal The detector comes after the video filter The detector co...

Page 244: ... other measured values are ignored On the basis of the operating principles of detectors a few recommendations can be made as to their use C It is best to use the Auto Peak detector or the peak detector for spectrum analysis over large frequency ranges This ensures that all signals are displayed C The RMS detector is recommended for power measurements on modulated signals However the display range...

Page 245: ......

Page 246: ...Auto span 158 Automatic scaling 161 Average detector 168 Average trace 91 Averaging time 116 Band class 171 Bandwidth 84 resolution 84 video 86 Base station test 176 187 196 201 Beeper 107 BitReverse 194 Burst length 51 Cable length 159 Cable measurement test setup 150 Cable model 155 Cable tests 150 Calibration 123 124 147 155 state 124 Calibration kit 124 128 155 Calibration method 125 Calibrati...

Page 247: ...ware 20 FM demodulator 103 Forward power display 119 Frame 73 spectrogram 73 Free run 88 Frequency counter 102 mode 108 offset 78 range 79 158 settings 77 114 119 158 start stop 79 158 Full span 80 Gate settings 91 Gated sweep 88 90 GPS position 173 GPS synchronization 196 201 Hadamard 194 Harmonic distortion 63 adjust settings 65 harmonics 64 harmonics list 65 THD 64 History 69 Hold spectrogram 6...

Page 248: ...n scalar 129 transmission vector 133 vector 132 vector voltmeter 146 149 VSWR 137 Measurement format 136 149 154 Measurement report 218 Measurement setup 17 Memory trace 95 142 Menus 21 DTF 35 38 general 21 network analyzer 28 power meter 34 receiver 32 spectrum analysis 23 MIMO 210 Min hold 92 Min peak 93 Multiple traces 95 n dB down 103 Network analysis 122 Noise power 101 Normalization NA 123 N...

Page 249: ...isplay 185 Screen layout 13 1xEV DO 197 ACLR 53 AM modulation depth 66 CDMA2000 188 channel power 43 code domain channel table 183 192 code domain power 180 190 constellation diagram 206 DTF mode 151 file manager 213 harmonic distortion 64 LTE 202 occupied bandwidth 46 power meter 113 power meter directional 117 report generator 219 resource allocations 207 spectrogram 68 spectrum emission mask 61...

Page 250: ...econd 95 Trace average 91 Trace mathematics 96 Trace memory 95 Trace mode 91 Trace selection 95 Tracking generator 123 Tracking generator power 161 Traffic activity 198 204 Transducer 84 109 unit 110 Transmission channel 56 Trigger 88 196 201 Trigger delay 89 Trigger level 90 Unit 81 channel power 45 directional power sensor 120 power sensor 115 transducer 110 User interface 13 VBW 86 Vector measu...

Reviews: