65
point too far away from the black body curve, UDACT
will fail. However, in this case the visual match has a
higher priority than a metrical base.
When the visual match is performed, return to the
main window, place the measurement device on
the screen and measure the whitepoint. Then press
„Calibrate“ to re-calibrate the display to the new
whitepoint and - if adjusted - luminance. The tonal
response of the original profile will be kept.
Notice:
It is necessary to perform an initial calibra-
tion becauee iColor Display needs a basis for the
calculations.
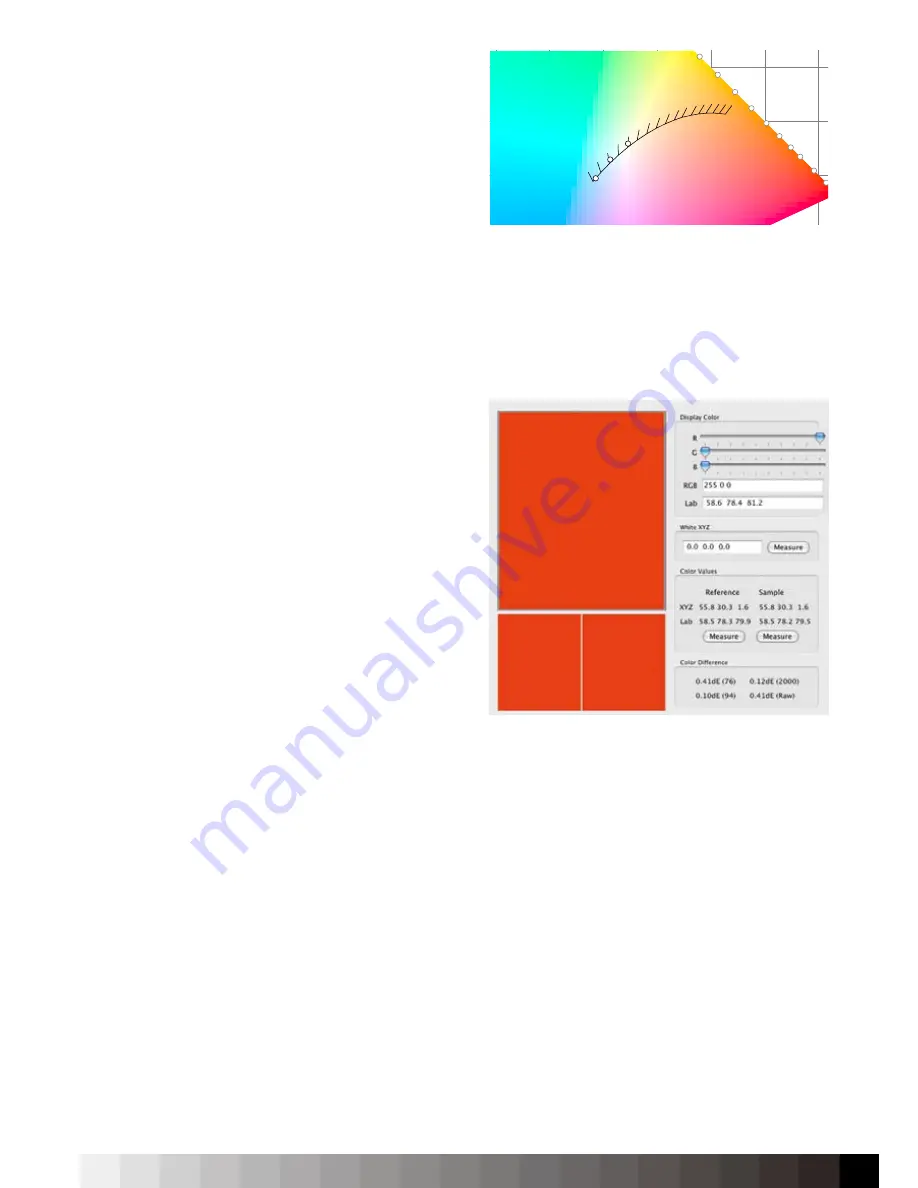
Spot Color / Color Differences
To evaluate the color representation, iColor Display’s
Spot Color measurement allows to measure two
colors and calculates the color deviation between
them. Possible colormanagement workflow issues
can be traced by measuring between two applica-
tions - for example Red 255 in Adobe Photoshop and
Adobe Indesign.
At first, place the measurement device on the mea-
surement window. Then, perform a white measure-
ment and press „Measure“.
You can either define a color in iColor Display, mea-
sure it here, define the same color in another appli-
cation and perform a second measurement.
You can also measure any color in an application.
Define the color in one application (like Photoshop)
and measure the reference there. Then, define the
color in the second application and measure the
sample. Make sure that the position of the measure-
ment device is not changed to avoid wrong readings
due to display non-uniformity.
iColor Display will display the color deviations below
the measured values.
Lightbox
This feature is used to measure the luminance and
paper white of a whitebox and to adjust the lumi-
nance with USB-interfaced lightboxes from Quato
or Just. Additionally, you can perform ambient light
measurements if the measurement device supports
The spot color option lets you compare colors .
380
460
470
475
480
485
490
495
500
505
510
515
520 525
530
535
540
545
550
555
560
565
570
575
580
585
590
595
600
605
610
620
635
700
0.0
0.1
0.2
0.3
0.4
0.5
0.6
0.7
0.8
0.9
1.0
0.0
0.1
0.2
0.3
0.4
0.5
0.6
0.7
0.8
0.9
1.0
x
y
2000
2105
2222
2353
2500
2677
2857
3077
3333
3636
4000
4444
5000
5714
6667
8000
10000
D50
D65
D93
The black body curve within the chromatic diagram.
Summary of Contents for iColor Display 3.7
Page 1: ...iColor Display 3 7 Intelli Proof Displays Manual ...
Page 13: ...13 ...
Page 17: ...17 ...
Page 22: ...22 Intelli Color 190 Intelli Color 201 and 213 Connection Layout ...
Page 23: ...23 Intelli Proof 190 and 201 Intelli Proof 213 and 213 excellence ...
Page 27: ...27 ...
Page 41: ...41 This page has been intentionally left blank ...
Page 67: ...67 ...
Page 68: ...68 ...
Page 69: ...69 ...
Page 70: ...70 ...
Page 71: ...71 ...
Page 72: ...72 ...
Page 73: ...73 ...


