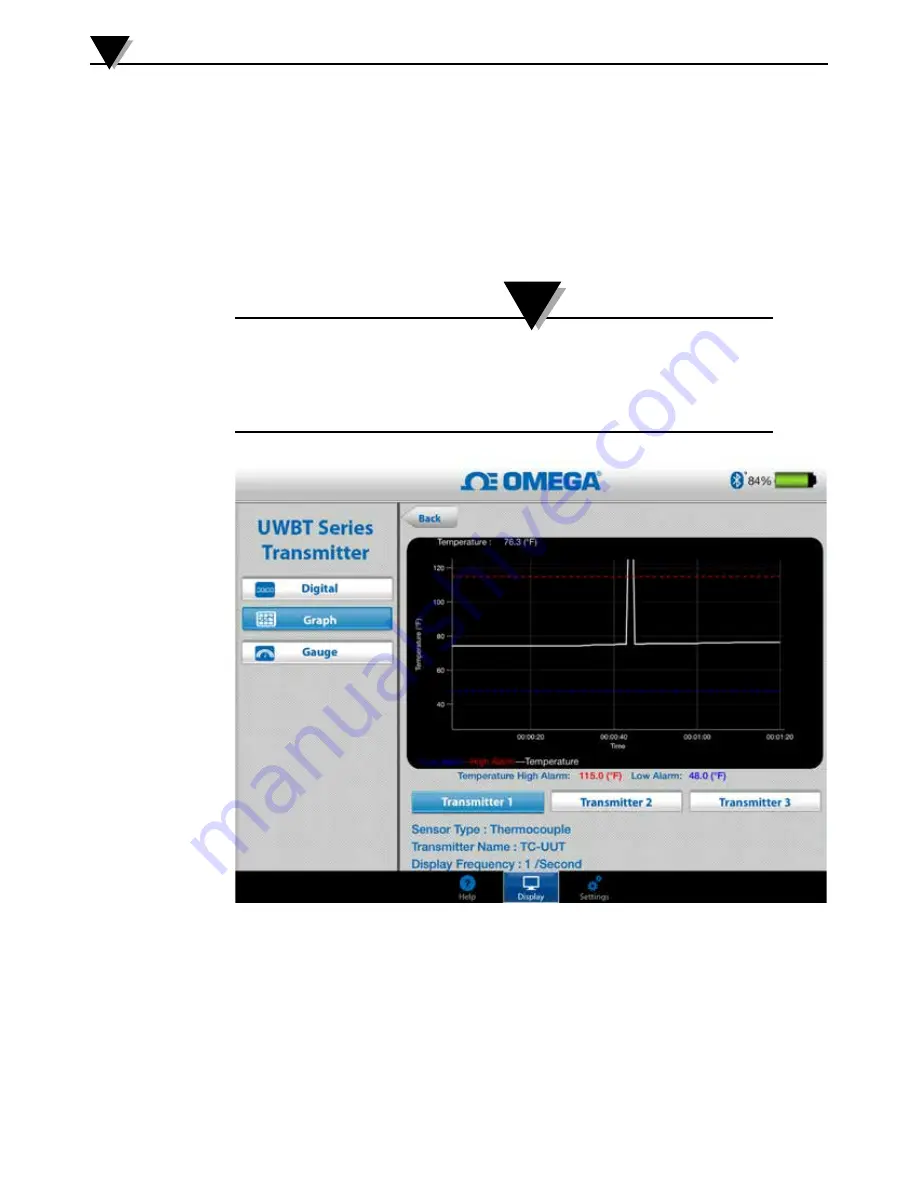
At the bottom of the Live Graph screen, you have the option to either allow the
app to automatically scale the Y-axis, or set the parameters on your own. Auto-
Scaling allows you to always see your data line, on the screen. To manually set
the y-axis scaling, simply un-check the box labeled “Y-Axis Auto Scaling”, and
enter the preferred values.
You can record the live data directly from this screen. At the bottom half of the
Live Graph screen, hit the “Start Logging” button. The data will be logged to the
smartphone/tablet. While logging, the top left of your screen will show “REC”
as a reminder.
For locally logged data, the log file’s first record will be one time
constant behind the time printed in the file name. For example,
for logging at 1 sample per 30 seconds starting at 1:00:00, the
first entry in the .csv file would be 1:00:30.
Figure 4-7. Live Temperature Graph With High And Low Alarms
Software Instructions (iOS)
4
4-8
NOTE:


