56
Chapter 10
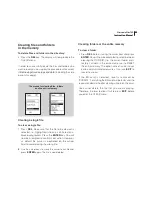
Multispectrum measurements
Frequency
Time
1
3
2
4
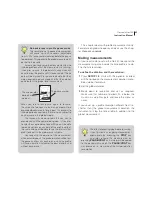
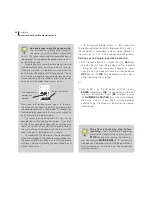
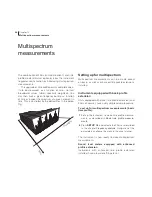
By following line
1
, the time profile
(the level vs. time) of one specific fre-
quency band is obtained. To display the
time profile of another frequency band (e.g.
line
2
) you must use the vertical cursor keys. At
any moment in time you may display the spectrum
(use the
f
↔
t
key). This could correspond to line
3
. While
you display the spectrum at a given moment in time, you may
use the vertical cursor keys to display the spectrum of another
moment in time, e.g. line
4
. In other words, the vertical cursor keys
are used to move in the other domain than the one displayed – to
move in time when displaying the spectrum and to move in fre-
quency when displaying a time profile.
To move the cursor along the time profile axis:
1
Make sure the display shows the time profile (level
vs. time). If needed, use the
f
↔
t
key.
2
Use the and the keys to move the cursor along
the time axis.
3
Use the and the keys to move the cursor one
screenwidth along the time axis in either direction.
To see the spectrum of another moment in time:
1
Make sure the instrument is in profile mode and that
the spectrum is displayed (a
Δ
displayed in the up-
per left corner of the display). If not, press the
Σ↔Δ
key to enter profile mode and the
f
↔
t
key to enter
the frequency domain.
2 Use the and the keys (repeatedly, if needed)
to reach the moment in time required.
Summary of Contents for nor140
Page 4: ......
Page 16: ......
Page 17: ...nor140 SOUND ANALYSER ...
Page 18: ......
Page 212: ...194 ...
Page 218: ......


