Oudie 3
48
© 2003 - 2013 ... Naviter d.o.o.
5
Statistics page
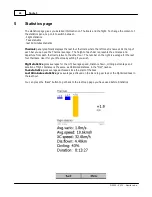
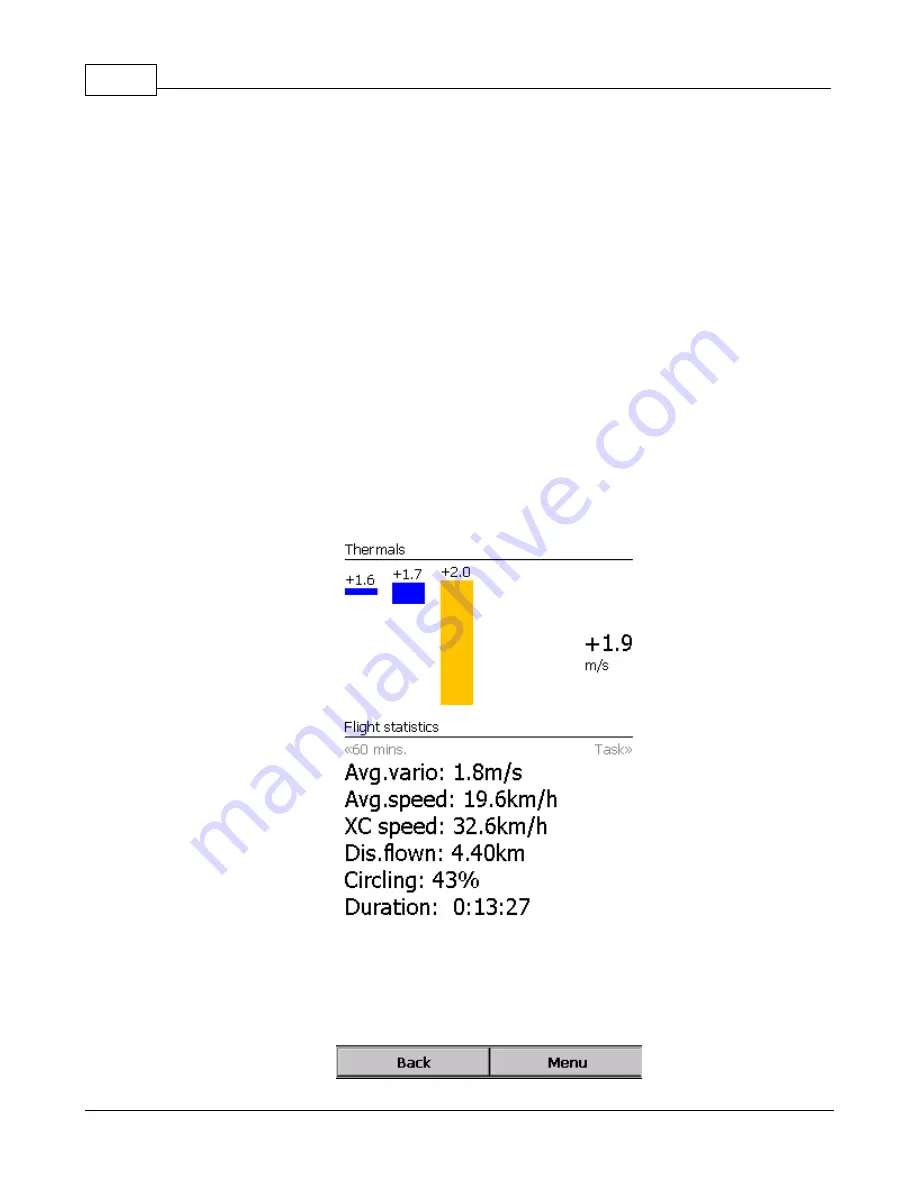
The statistics page gives you detailed information on Thermals and the flight. To change the content of
the statistics pane, tap on it to switch between
. Flight statistics
. Task statistics
. last 60 minutes statistics
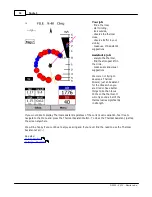
Thermals
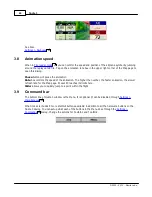
panel graphically displays the last four thermals where the left most is newest. At the top of
each bar you can see the Thermal average. The height of each bar represents the entrance and
departure from each thermal relative to the other four. The number on the right is average for the last
four thermals. Use it for your MacCready setting if you wish.
Flight statistics
gives averages for the Lift, Average speed, Distance flown, circling percentage and
duration of flight. Distance is the same as Optimized distance in the "Opt" navbox.
Task statistics
gives averages achieved since the start of the task.
Last 60 minutes statistics
gives averages achieved on the Race to goal task or the Optimized task in
the last hour.
You can press the "Back" button to get back to the last map page you have used before Statistics.
Summary of Contents for Oudie 3
Page 1: ...2003 2013 Naviter d o o Oudie 3 Help Last modified 26 7 2013 for version 4 50...
Page 5: ...Part I...
Page 8: ...Part II...
Page 30: ...Oudie 3 26 2003 2013 Naviter d o o...
Page 35: ...Getting started 31 2003 2013 Naviter d o o...
Page 39: ...Part III...
Page 44: ...Oudie 3 40 2003 2013 Naviter d o o...
Page 49: ...Part IV...
Page 51: ...Part V...
Page 53: ...Part VI...
Page 77: ...Part VII...
Page 110: ...Oudie 3 106 2003 2013 Naviter d o o See also Using vario Volume altitude 12 109...
Page 111: ...Part VIII...
Page 118: ...Oudie 3 114 2003 2013 Naviter d o o...
Page 120: ...Oudie 3 116 2003 2013 Naviter d o o...
Page 121: ...Part IX...
Page 123: ...Part X...
Page 126: ...Part XI...
Page 128: ...Part XII...
Page 130: ...Part XIII...

