G
RAPH AND
S
AMPLE
O
VERLAYS
In 21CFR11 environments, this feature is applicable to members of the Developer
group only.
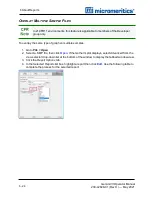
Use the graph overlay functions to compare multiple graph options. Graphical lines are
differentiated by the use of varying colored symbols outlined on a legend. Overlays may be
generated in two ways:
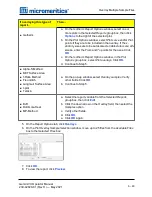
n
Multiple Graph Overlays.
Overlay two different types of graphs from one sample.
n
Multiple Sample Overlays.
Overlay graphs of the same type with that of the current plot. This
type of overlay is available only for:
o
BJH Adsorption / Desorption
o
DFT Pore Size / Surface Energy
o
Dollimore-Heal Adsorption / Desorption
o
Horvath-Kawazoe
o
M-P Method
This feature is available only when using
Advanced
option presentation. Go to
Options > Option Presentation > Advanced
.
Graph and Sample Overlays
Gemini VII Operator Manual
239-42828-01 (Rev H ) — May 2021
6 - 27
Summary of Contents for GEMINI VII
Page 1: ...OPERATOR MANUAL 239 42828 01 May 2021 Rev H GEMINI VII SURFACE AREA ANALYZER ...
Page 10: ......
Page 16: ......
Page 92: ......
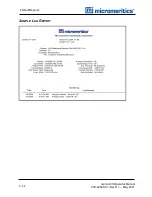
Page 126: ...6 About Reports SAMPLE LOG REPORT 6 34 Gemini VII Operator Manual 239 42828 01 Rev H May 2021 ...
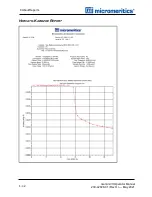
Page 127: ...T PLOT REPORT t Plot Report Gemini VII Operator Manual 239 42828 01 Rev H May 2021 6 35 ...
Page 128: ...6 About Reports VALIDATION REPORT 6 36 Gemini VII Operator Manual 239 42828 01 Rev H May 2021 ...
Page 234: ......
Page 242: ......
Page 244: ......
Page 247: ......
Page 248: ......


