


Given the density profile, the amount adsorbed at the stated pressure can be easily calculated as
the integral over the profile. Repeating this calculation over a range of pressures yields the
adsorption isotherm for the model. If the value of H is very large, the isotherm obtained
corresponds to that of an external, or
free
, surface. If H is smaller, a range of pressures is reached
where two minima exist for the grand potential, showing the presence of two metastable phases
having different density distributions but the same chemical potential. The phase with the lower
GPE is the stable one. As the pressure is increased, a point is reached where the other phase
becomes the stable one. This phase transition reflects condensation of adsorbate in the pore; the
pressure at which it occurs is called the
critical pore-filling pressure
. This pressure is analogous to
the condensation pressure predicted by the Kelvin equation in the classical model of pore filling.
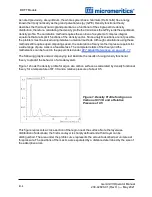
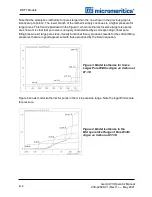
Figure 2 shows how the profiles change with pressure for a model pore with H = 40 angstroms.
The inset shows the density profiles for the corresponding points of the isotherm.
Figure 2. Model Isotherm for Argon at
87.3 K in a 40 Å Slit in a Carbon
Substrate
The profiles show the density distribution from one wall to the center of the slit; the other half of the
distribution is a mirror image of the profile shown.
As the pressure is first increased from zero, almost all the adsorbed atoms occupy a position close
to the surface.
n
Inset
a
shows the profile corresponding to point a on the isotherm where the surface is about
half covered.
n
At point
b
, the first layer is so full that it is more favorable for atoms to start a new layer.
n
At point
c
, a third layer is forming. Point
c
, for this size slit, is the critical pore-filling pressure. In
inset
c
, the profile shows the density decreasing to near zero (actually the bulk gas density) at 4
or 5 molecular diameters from the surface.
n
Inset
d
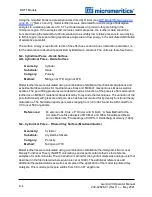
shows the profile converging on a density similar to that of bulk liquid argon in the center
of the pore, indicating a phase transition.
Models Based on Statistical Thermodynamics
Gemini VII Operator Manual
239-42828-01 (Rev H ) — May 2021
B - 5
Summary of Contents for GEMINI VII
Page 1: ...OPERATOR MANUAL 239 42828 01 May 2021 Rev H GEMINI VII SURFACE AREA ANALYZER ...
Page 10: ......
Page 16: ......
Page 92: ......
Page 126: ...6 About Reports SAMPLE LOG REPORT 6 34 Gemini VII Operator Manual 239 42828 01 Rev H May 2021 ...
Page 127: ...T PLOT REPORT t Plot Report Gemini VII Operator Manual 239 42828 01 Rev H May 2021 6 35 ...
Page 128: ...6 About Reports VALIDATION REPORT 6 36 Gemini VII Operator Manual 239 42828 01 Rev H May 2021 ...
Page 234: ......
Page 242: ......
Page 244: ......
Page 247: ......
Page 248: ......


