Power and Voltage Quality Trainer
AD 2
– MI 3399
148
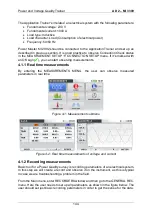
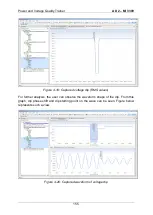
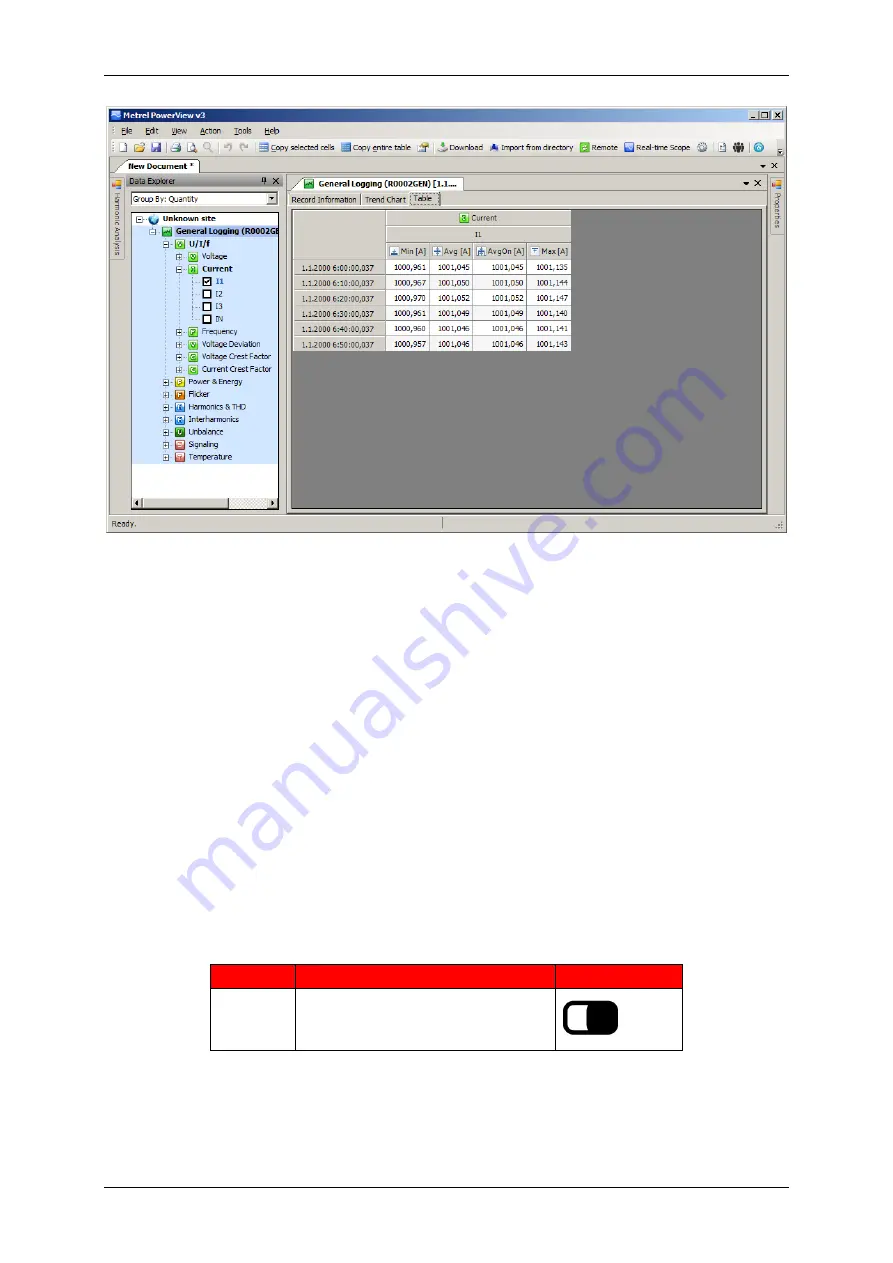
Figure 4-9: Table view
Depending on the parameter we're observing in “Table” view (in our case current), few
options are shown:
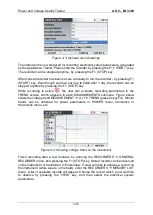
Min
– presents minimal 10/12 cycle RMS value in given time interval,
Avg
– presents RMS average of 10/12 cycle RMS in given time interval,
AvgOn
– presents only non-zero RMS average of 10/12 cycle measurements in
given time interval (same as Avg, but doesn’t take zero measured values into
account). This measurement is useful for evaluating switch type of load
Max
– presents maximal 10/12 cycle RMS value in given time interval.
Other data (power, harmonics, etc.) can be accessed and analysed in similar fashion.
4.2 Exercise 2
– Voltage Dip
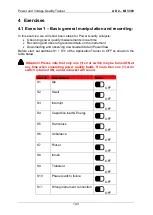
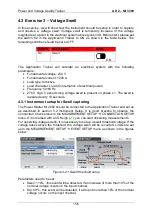
In this exercise, we will show how the instrument should be setup in order to capture
and observe a voltage dip. Voltage dip is a temporary reduction of the voltage
magnitude at a point in the electrical system below given limit. Before start, please set
the switch S1 in the Application Trainer to ON as shown in the table below. The
remaining switches should be set to OFF.
Switch
Description
State
S1
Dip
ON
The Application Trainer will simulate an electrical system with the following
parameters:
Fundamental voltage: 230 V
Fundamental current: 1000 A
Summary of Contents for MI 3399
Page 27: ...Electrical Installation Safety Trainer AD 1 MI 3399 27...
Page 46: ...Electrical Installation Safety Trainer AD 1 MI 3399 46 3 Exit settings...
Page 74: ...Electrical Installation Safety Trainer AD 1 MI 3399 74...
Page 197: ...Power and Voltage Quality Trainer AD 2 MI 3399 197 Figure 4 89 Transient Chart view...
Page 204: ...PAT Appliances Machines Safety Trainer AD 3 MI 3399 204...
Page 249: ...PV Photovoltaic Systems Trainer AD 4 MI 3399 249...
Page 250: ...PV Photovoltaic Systems Trainer AD 4 MI 3399 250 AD 4 MI 3399 PV Photovoltaic Systems Trainer...

