4 - 28
4.3.4 Cursor Display
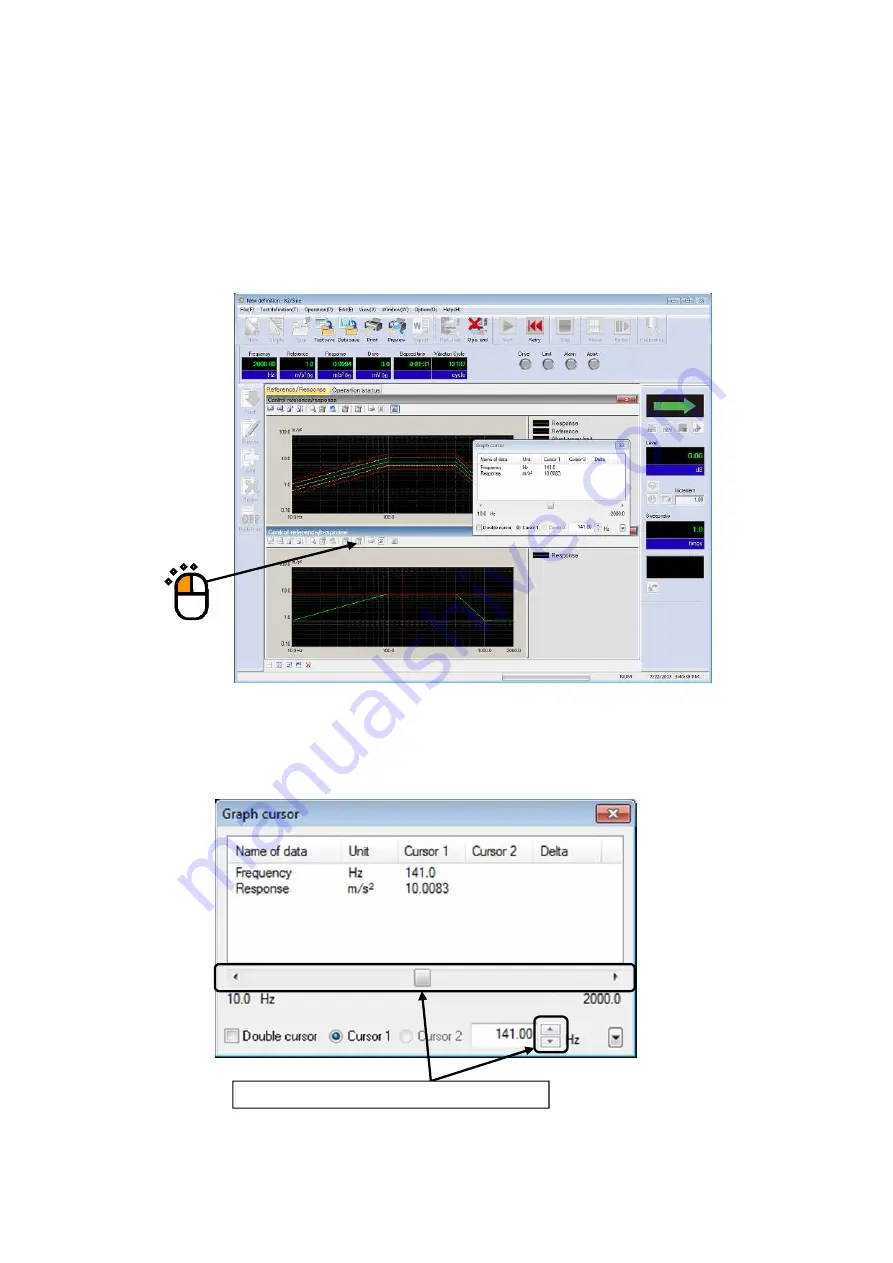
This function is for displaying of hairline cursors in a specified graph currently displayed.
< Procedures >
< Step 1 >
Right-click the mouse button on the graph or click the “cursor button” to display the cursor in the
graph.
< Step 2 >
Use the dialog of ‘Graph cursor’. The cursor in the graph is shifted by the operation.
Use these buttons to shift the cursor by a mouse.
Summary of Contents for K2-CE
Page 4: ......
Page 34: ...2 6 Step 2 The initial screen of installation appears Press the button of Next...
Page 38: ...2 10 Step 2 The initial screen of installation appears Press the button of Next...
Page 49: ...2 21 Step 2 The initial screen of installation appears Press the button of Next...
Page 55: ...2 27 Step 3 The screen displaying the message of Uninstall or change a program appears...
Page 58: ...2 30 Step 3 The screen displaying the message of Uninstall or change a program appears...
Page 81: ......
Page 82: ......
Page 92: ...4 3 4 2 2 Exit from Application 1 K2 Launcher Press the button Close on the screen...
Page 107: ...4 18 Step 3 A graph of the page displayed currently appears in the display...
Page 110: ...4 21 Step 3 Additional graph appears on the currently displayed page...
Page 121: ...4 32 Step3 Press the Mark button to mark the cursor data displayed in the list...
Page 141: ...4 52 Step 2 Press Yes when a dialog of message for assuring appears...
Page 149: ...4 60 Step 5 Press the OK button...
Page 170: ...4 81 Step 9 Press OK after completing of the necessary settings...
Page 172: ...4 83 Report of testing result generated by Report Generator...
Page 196: ...6 12 Step 3 Select desired data file Some files can be selected at a time...
Page 201: ...6 17 Step 3 Select desired data file Some files can be selected at a time...
Page 212: ...7 6 7 2 2 Standards Mode Procedures Step 1 Press the button of Standards...
Page 217: ...7 11 7 2 3 Test files mode Procedures Step 1 Press the button of Test files...


