


Page 12-26
if in RPN mode). Then, press
@ERASE @DRAW
. Press
@CANCL
to return to the PLOT,
PLOT WINDOW, or PLOT SETUP screen. Press
$
, or
L
@@@OK@@@
, to return
to normal calculator display.
Generating a table for parametric equations
In an earlier example we generated a table of values (X,Y) for an expression
of the form Y=f(X), i.e., a Function type of graph. In this section, we present
the procedure for generating a table corresponding to a parametric plot. For
this purpose, we’ll take advantage of the parametric equations defined in the
example above.
•
First, let’s access the TABLE SETUP window by pressing
„õ
,
simultaneously if in RPN mode. For the independent variable change
the
Start
ing value to 0.0, and the
Step
value to 0.1. Press
@@@OK@@@
.
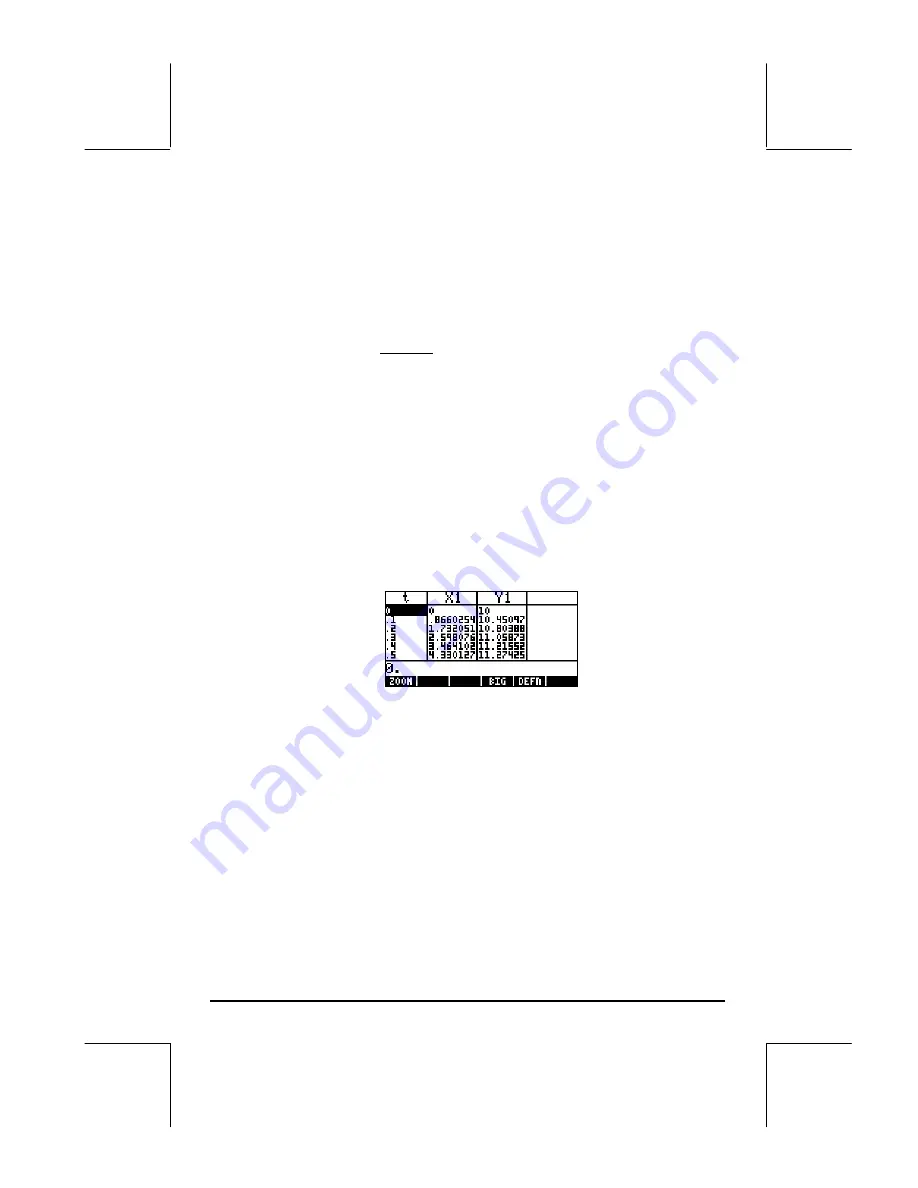
•
Generate the table by pressing, simultaneously if in RPN mode,
„ö
. The resulting table has three columns representing the
parameter t, and the coordinates of the corresponding points. For
this table the coordinates are labeled X1 and Y1.
•
Use the arrow keys,
š™—˜
, to move about the table.
•
Press
$
to return to normal calculator display.
This procedure for creating a table corresponding to the current type of plot
can be applied to other plot types.
Plotting the solution to simple differential equations
The plot of a simple differential equation can be obtained by selecting
Diff
Eq
in the
TYPE
field of the PLOT SETUP environment as follows: suppose that
we want to plot x(t) from the differential equation dx/dt = exp(-t
2
), with initial
conditions: x = 0 at t = 0. The calculator allows for the plotting of the solution