

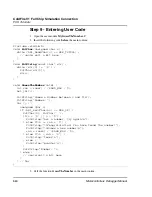


ColdFire V1 Full Chip Simulation Connection
FCS Tutorials
664
Microcontrollers Debugger Manual
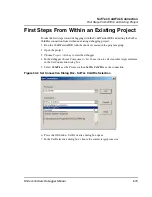
5. Enter a project name like
PWM_Sample
6. Change the directory if you want (
Location > Set
)
7. Check
C
for the language and click
Next
.
8. Click
Next
again (you do not want to add additional files)
9. Choose
Processor Expert
and click
Next
.
10. Click
Finish
to keep the default options.
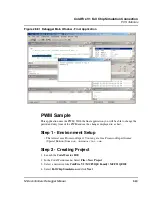
The debugger creates a new project using the wizard and Processor Expert is available.
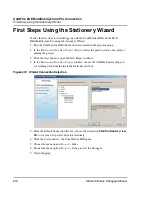
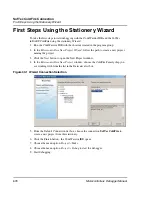
During this process, several windows appear, allowing you to select additional
options. Close these windows to retain the default settings. Several Processor Expert
windows are visible.
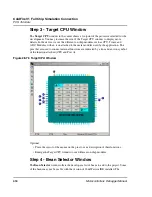
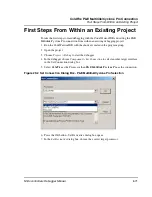
Step 3 - Target CPU Window
The
Target CPU
window in the center shows a footprint of the processor selected for the
development. In the device, we see the different on-chip modules such as CPU, Timer, and
the ADC. Modules with an icon attached to them are modules used by the application. The
pins that are used to connect external functions are indicated by a line and an icon, symbol
of the function attached (CPU and Port A).
Optional:
• Place the cursor of the mouse on the pins to see a description of their functions.
• Enlarge the
Target CPU
window to see different on-chip modules.
Step 4 - Creating PWM Bean
• Select
Bean Categories > CPU internal peripherals > Timer > PWM
• In the context menu select ‘Add Bean to the Current Project’ to add an instance of the
AsynchroSerial bean to the project.
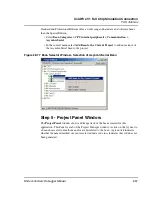
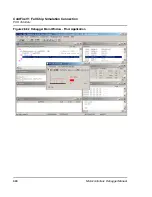
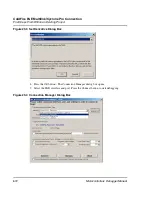
Step 5 - Project Panel Window
The
Project Panel
window shows and keeps track of the beans created for this
application. This Panel is a tab of the Project Manager window. Click on the [+] next to a
bean to show a list of methods and/or events related to the bean. A green tick indicates
whether the named method or event is selected and a red cross indicates that code has not
been generated.
Locate the previously created bean with the name
PWM1:PWM
under
Beans
.
Summary of Contents for Microcontrollers
Page 1: ...Microcontrollers Debugger Manual Revised 22 October 2007 ...
Page 20: ...Table of Contents 20 Microcontrollers Debugger Manual ...
Page 24: ...Book I Contents 24 Microcontrollers Debugger Manual ...
Page 60: ...Debugger Interface Highlights of the User Interface 60 Microcontrollers Debugger Manual ...
Page 156: ...Debugger Components Visualization Utilities 156 Microcontrollers Debugger Manual ...
Page 198: ...Real Time Kernel Awareness OSEK Kernel Awareness 198 Microcontrollers Debugger Manual ...
Page 236: ...Synchronized Debugging Through DA C IDE Troubleshooting 236 Microcontrollers Debugger Manual ...
Page 238: ...Book II Contents 238 Microcontrollers Debugger Manual ...
Page 332: ...HC08 Full Chip Simulation Configuration Procedure 332 Microcontrollers Debugger Manual ...
Page 348: ...MON08 Interface Connection Device Class Description 348 Microcontrollers Debugger Manual ...
Page 364: ...ICS MON08 Interface Connection Device Class Description 364 Microcontrollers Debugger Manual ...
Page 428: ...HC08 FSICEBASE Emulator Bus State Analyzer BSA 428 Microcontrollers Debugger Manual ...
Page 430: ...Book III Contents 430 Microcontrollers Debugger Manual ...
Page 466: ...HCS08 Full Chip Simulation Peripheral Modules Commands 466 Microcontrollers Debugger Manual ...
Page 544: ...HCS08 On Chip DBG Module HCS08 DBG V3 New Features 544 Microcontrollers Debugger Manual ...
Page 546: ...Book IV Contents 546 Microcontrollers Debugger Manual ...
Page 576: ...Book V Contents 576 Microcontrollers Debugger Manual ...
Page 698: ...Book VI Contents 698 Microcontrollers Debugger Manual ...
Page 714: ...Flash Programming NVMC Commands 714 Microcontrollers Debugger Manual ...
Page 730: ...Book VII Contents 730 Microcontrollers Debugger Manual ...
Page 840: ...Book VIII Contents 840 Microcontrollers Debugger Manual ...
Page 864: ...Book IX Contents 864 Microcontrollers Debugger Manual ...
Page 868: ...Legacy Target Interfaces Removed 868 Microcontrollers Debugger Manual ...