•
Bytes Transferred
•
Network Savings (in percentage)
For more information, see
Monitoring Container Statistics
.
Statistics: Replication Page
To display the Statistics: Replication page, click Dashboard
→
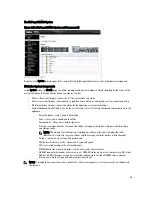
Statistics: Replication. This page lets you view and
monitor statistics for replication containers or peer DR Series systems that you select, and consists of two main panes:
•
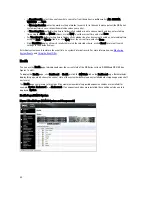
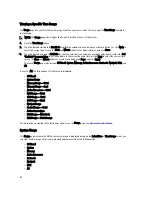
Replication Filter—the Container Filter lets you select all, one, or multiple replication containers, one or more
peer systems, and configure a variety of statistics types to display in the Replication statistics summary table.
You can choose from the 10 Headers check boxes: Peer Status, Replication Status, Time To Sync, Progress %,
Replication Throughput, Network Throughput, Network Savings, Last Time In Sync, Peer Container, and Peer
System to filter the type of replication statistics used in the search.
•
Replication Statistics—contains a summary table that displays the filtered results of the replication statistics
from the Replication Filter pane for the container or peer system choices you made. The summary table displays
the category of statistics based on the check boxes you selected.
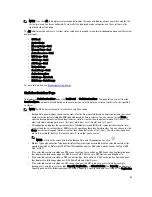
NOTE: Starting with Release 2.0, the DR Series system software includes version checking that limits replication
only between other DR Series systems that run the same system software release version (DR Series systems
running Release 2.0.x software can only replicate with other DR Series systems that run the same release system
software). For example, Release 2.0.x systems will not be able to replicate with Release 2.1 or Release 3.0 systems,
but can replicate with systems running Release 2.0.0.1 or 2.0.0.2.
For more information, see
Monitoring Replication Statistics
,
Displaying Replication Statistics
, and
Displaying the
Statistics: Replication Page
.
Container Filter
The Replication Filter pane in the Statistics: Replication page contains the following components:
•
Container Filter:
– All (selecting this option lets you select all replication containers in the system)
– Name (selecting this option and drop-down list lets you select replication containers)
– Peer System (selecting this option and list box let you select peer DR Series systems)
•
Headers (selecting the following check boxes let you filter for specific replication statistic types)
– Peer Status
– Replication Status
– Time to Sync
– Progress % (percentage)
– Replication Throughput
– Network Throughput
– Network Savings
– Last Time in Sync
– Peer Container
– Peer System
NOTE: The DR Series system polls for statistics every 30 seconds.
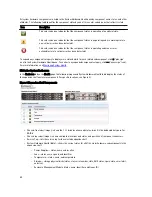
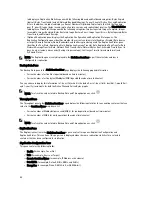
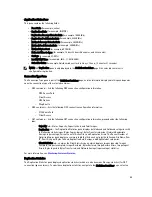
After you have configured the Replication Filter settings, click Apply Filter to display the filtered set of replication
statistics in the Replication Filter summary table. The Replication filter summary table lists the replication statistics that
57
Summary of Contents for PowerVault DX6112
Page 1: ...Dell DR Series System Administrator Guide ...
Page 32: ...32 ...
Page 70: ...70 ...
Page 86: ...86 ...
Page 100: ...For more information on Replication schedules see Creating a Replication Schedule 100 ...
Page 114: ...114 ...


