•
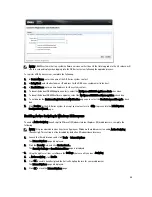
In Event Severity, select the event severity to search for from the options in pull-down list: ALL, CRITICAL,
WARNING, and INFO.
•
In Message Contains, enter the word or string of words to search for in the events message text (the DR Series
system performs a case-insensitive match based on your entry).
•
In Timestamp From, enter starting time in field or click calendar icon to choose month and day, enter starting
time using the Hour and Minute sliders, or click Now to set the current time, and click Done.
•
For Timestamp To, enter starting time in field or click calendar icon to choose month and day, enter ending time
using the Hour and Minute sliders, or click Now to set the current time, and click Done.
•
Click Start Filter display all search results that match the selected criteria, or click Reset to return all search
settings to their default values.
All critical system events remain in the event list as a system historical record. For more information, see
Monitoring
System Events
, and
Using the Event Filter
.
Health
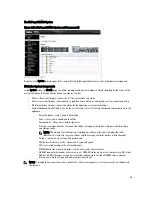
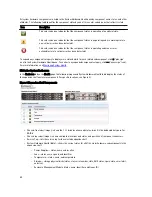
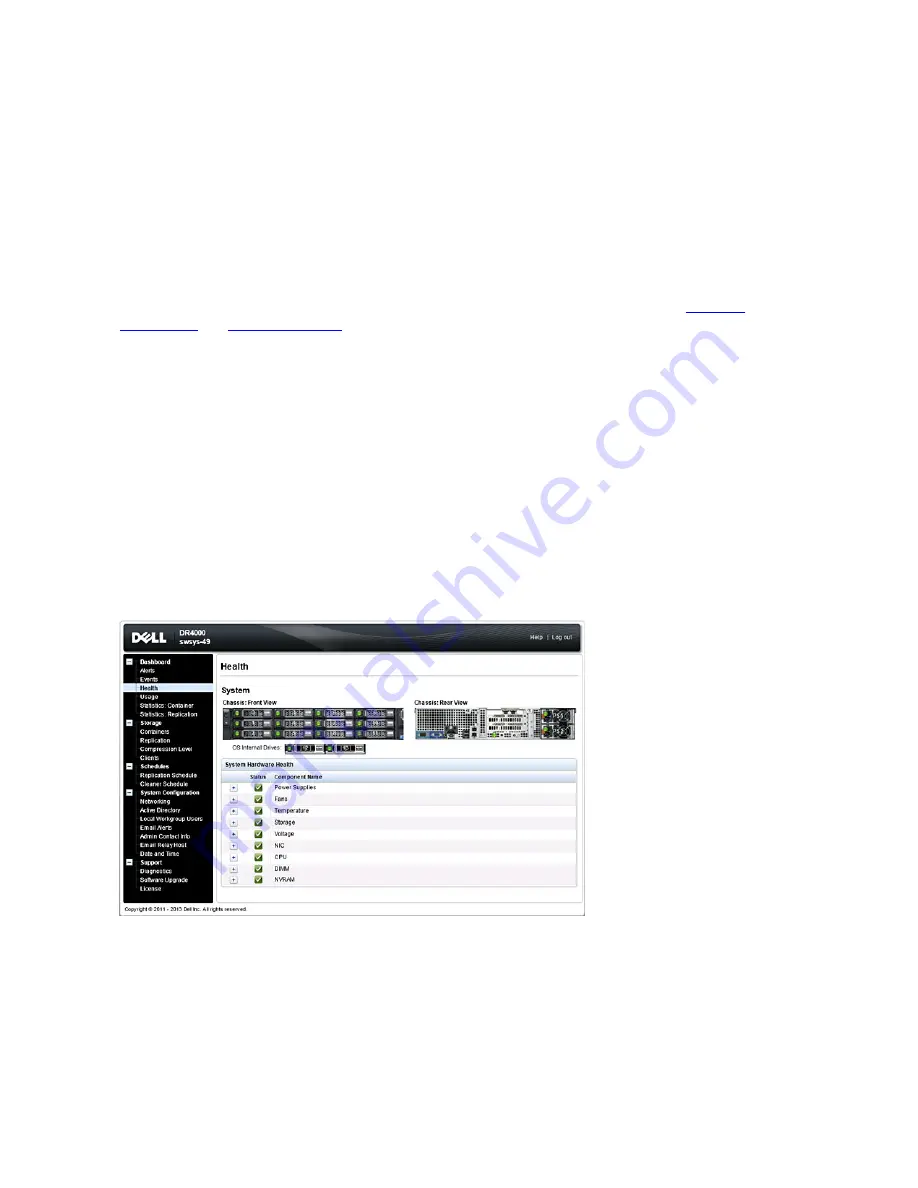
You can use the Health page to display and view the current state of the DR Series systems, DR4000 and DR4100, (see
Figures 1 and 2).
To display the Health page, click Dashboard
→
Health or click the HW State link on the Dashboard page. Both methods
display this page, which shows the current state of the system hardware (and any installed data storage expansion shelf
enclosure).
The Health page contains up to three tabs if the maximum number of supported expansion shelves are installed (for
example: System, Enclosure 1, and Enclosure 2). If no expansion shelves were installed, there will be only be one tab
displayed (System).
Health Page: DR4000 System
Figure 1 Health Page (DR4000 System and Components)
48
Summary of Contents for PowerVault DX6112
Page 1: ...Dell DR Series System Administrator Guide ...
Page 32: ...32 ...
Page 70: ...70 ...
Page 86: ...86 ...
Page 100: ...For more information on Replication schedules see Creating a Replication Schedule 100 ...
Page 114: ...114 ...

