17
CONTACT CSI FOR MORE INFORMATION | CSIDESIGNS.COM | [email protected] | +1.417.831.1411
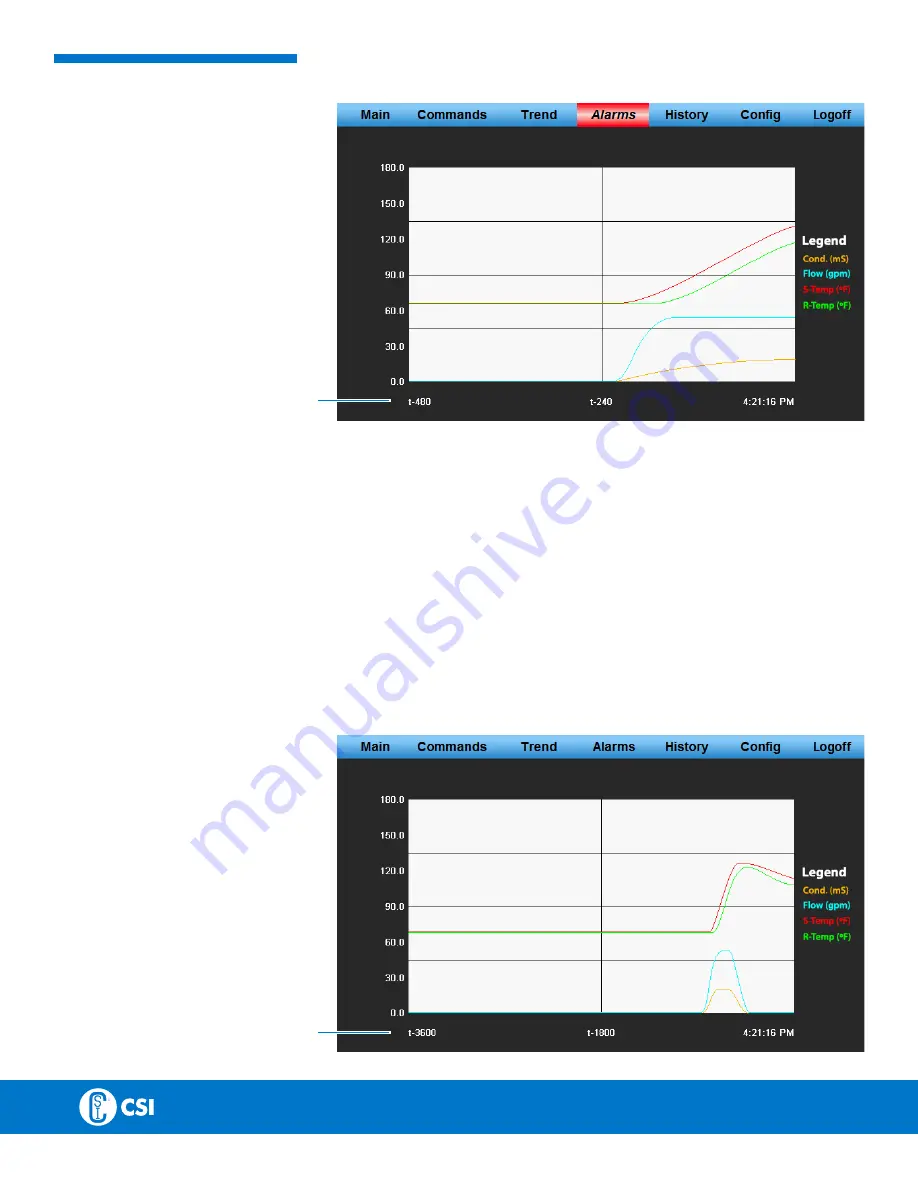
The Trend screen logs the actual process values of Supply Flow (Flow), Sup-
ply Temperature (S-Temp), Return Temperature (R-Temp), and Return Conductivi-
ty (Cond) . These data points are sampled every second and plotted on the same
graph for wash monitoring . This graph will display up to 8 minutes (480 seconds
or t-480) of data .
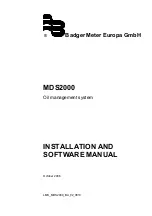
The History screen logs the actual process valves of Supply Flow, Supply
Temperature, Return Temperature, and Return Conductivity exactly as the Trend
screen does . The difference is the data points are sampled every eight seconds
allowing for monitoring a longer time frame such as a complete wash cycle . This
graph will display up to 1 hour (3600 seconds or t-3600) of data . Both the Histo-
ry and Trend screens are limited to 500 data points .
TREND
SCREEN
HISTORY
SCREEN


