Appendix C – APDiagnostics
86
Epica DGX 144 Instruction Manual
System Visual Pane
Event Status Notebook
The Event Status Notebook is the panel with four tabs at the bottom of the Main Screen. The tabs in the
Event Status Notebook provide current data (Acquisition mode) or previous data (Emulation mode).
It provides updated status entries as the system is being monitored, providing a snapshot glance of the
most recent state of the system.
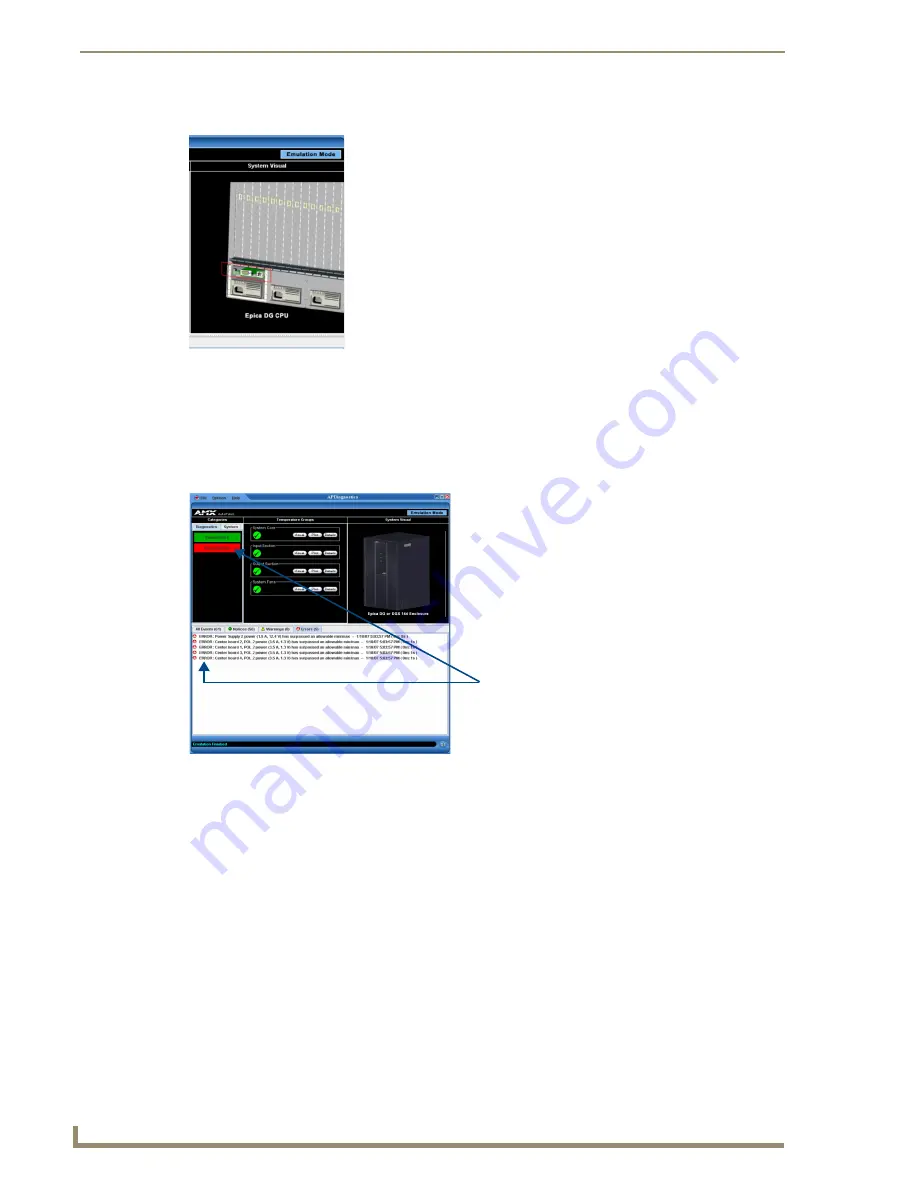
The System Visual pane is the right-most panel in the Main Screen and
presents a simple graphic representation of the different groups being
monitored by the application.
To display an appropriate image in the System Visual pane:
1.
In the Categories pane, select the Diagnostics tab.
2.
In the Information pane, click the Visual button for the applicable
Temperature Groups.
When components in the system exceed their
maximum and minimum levels of operation,
APDiagnostics flags that information as
warnings or errors depending on the data
received. APDiagnostics changes the color of
the Categories buttons in the Categories pane
(top arrow) to yellow for warning or red for error
and displays the information as Warnings or
Errors in the Event Status Notebook (bottom
arrow).
The information displayed in the Event Status Notebook is sorted under the following tabs: All Events,
Notices, Warnings, and Errors.
Summary of Contents for Epica DGX 144
Page 10: ...Notices 6 Epica DGX 144 Instruction Manual ...
Page 20: ...Overview and General Specifications 16 Epica DGX 144 Instruction Manual ...
Page 48: ...Installation and Setup 44 Epica DGX 144 Instruction Manual ...
Page 54: ...Epica DGX 144 SC Fiber Boards 50 Epica DGX 144 Instruction Manual ...
Page 72: ...Appendix A EDID Programmer 68 Epica DGX 144 Instruction Manual ...
Page 82: ...Appendix B Managing Configuration Files 78 Epica DGX 144 Instruction Manual ...
Page 106: ...Appendix E Board Replacement 102 Epica DGX 114 Instruction Manual ...


