


Appendix C – APDiagnostics
83
Epica DGX 144 Instruction Manual
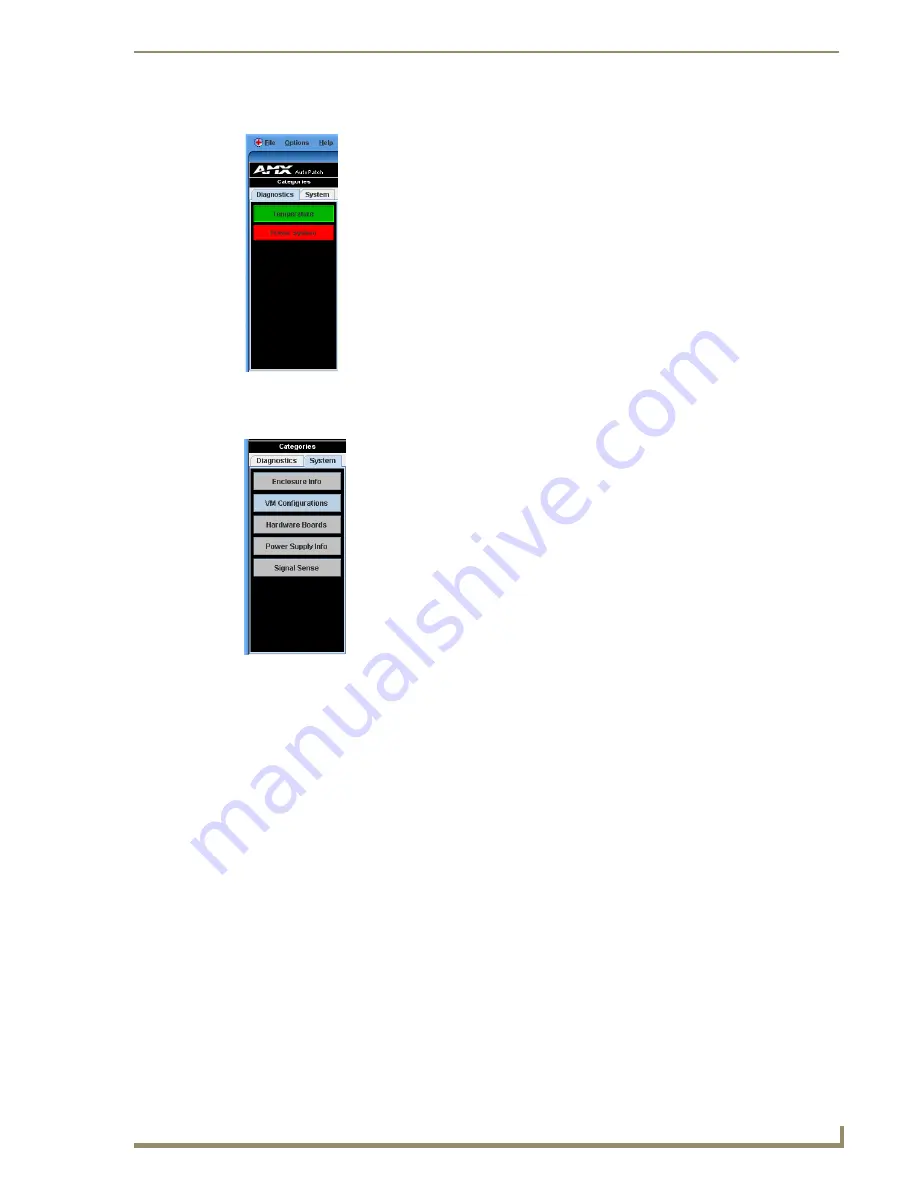
Diagnostics Tab
System Tab
The two buttons on the Diagnostics tab (Temperature and Power System) will turn
green, yellow, or red indicating Good, Warning, or Error state, respectively. A yellow
for warning or red for error button indicates that the maximum or minimum levels of
functioning for various components in the system have been exceeded. This allows
you to “drill down” into that particular sub-system for more detailed information
about the state of its lowest-level constituents.
To display diagnostic information for Temperature
and Power System groups:
1.
In the Categories pane, select the Diagnostics tab.
2.
Click either the Temperature or Power System button.
Visual, Plot, and Details buttons display in the Information pane (see page 84).
The five buttons on the System tab offer general information for the following:
Enclosure Info
VM Configurations
Hardware Boards
Power Supply Info
Signal Sense (for inputs)
To display general information for a particular component:
1.
In the Categories pane, select the System tab.
2.
Click one of the five buttons on the System tab.
The details display in the Information pane (see page 85).
Summary of Contents for Epica DGX 144
Page 10: ...Notices 6 Epica DGX 144 Instruction Manual ...
Page 20: ...Overview and General Specifications 16 Epica DGX 144 Instruction Manual ...
Page 48: ...Installation and Setup 44 Epica DGX 144 Instruction Manual ...
Page 54: ...Epica DGX 144 SC Fiber Boards 50 Epica DGX 144 Instruction Manual ...
Page 72: ...Appendix A EDID Programmer 68 Epica DGX 144 Instruction Manual ...
Page 82: ...Appendix B Managing Configuration Files 78 Epica DGX 144 Instruction Manual ...
Page 106: ...Appendix E Board Replacement 102 Epica DGX 114 Instruction Manual ...