background image

IM 701240-02E

0

Main Functions of the SL1400

History Memory

Section 11.1, "Displaying History Waveforms" in the user's manual

When waveforms are being measured, the waveform data stored in the acquisition memory as a result of a trigger being 
activated is displayed as waveforms on the SL1400 screen. When triggers are continuously activated and waveforms are ac-
quired, it is impossible to stop the measurement in time when an abnormal waveform appears (newer waveforms appear on 
the screen). Normally, abnormal waveforms in the past cannot be displayed. However, by using the history memory function, 
the past waveform data (history waveforms) stored in the acquisition memory can be displayed when waveform acquisition is 
stopped. A specific history waveform can be displayed.
In addition, waveforms that meet the specified conditions can be searched using the zone search or parameter search func-
tion.

History waveform

(Up to 2000 screens)

Selected Record No. 0

Selected Record No. –25

Specified zone

Detects the waveform 

that passed through 

the specified zone.

Selected Record No. -28

Selected Record No. 0

Detects waveforms whose 

specified waveform parameter 

exceeds the specified range.

History waveform

(Up to 2000 screens)

Zone search example

Parameter search example

P-P

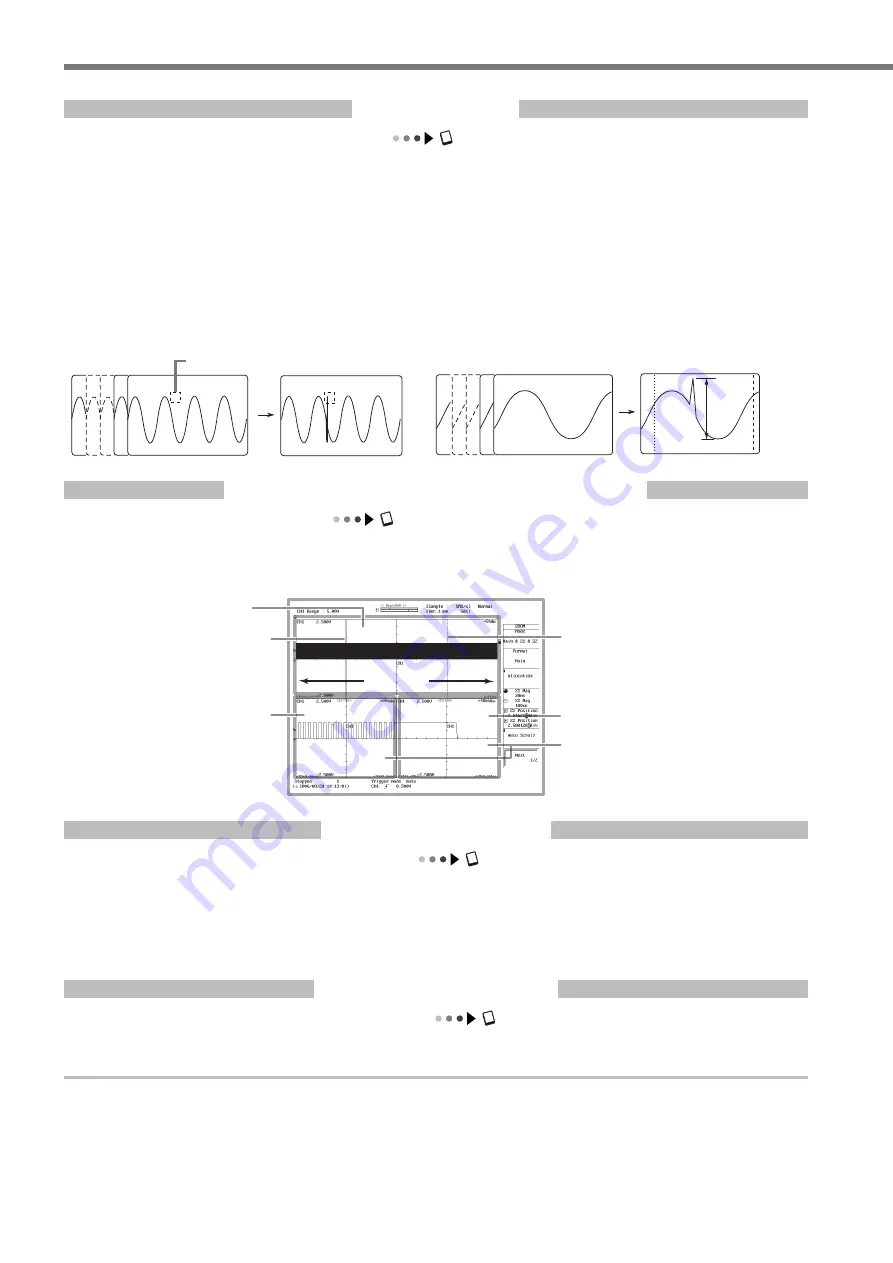
Zooming along the Time (Horizontal) Axis 

Section 8.5, "Zooming and Auto Scrolling the Waveform" in the user's manual

The displayed waveform can be expanded along the time (horizontal) axis. Two locations can be zoomed at once. This func-
tion is useful when the waveform acquisition time is set long and you want to observe a particular section of the waveform 
closely.

50 MW

Displays zoom waveforms (Z1 and Z2) 

of two arbitrary locations.

Zoom box Z1

Zoom box Z2

Zoom waveform window (Z1)

Zoom waveform window (Z2)

Normal waveform window

Displays the entire 50 MW of data

X-Y Waveform Display

Section 8.6, "Displaying X-Y Waveforms" in the user's manual

The level relationship between signals can be observed by assigning the signal level of a specified waveform on the X-axis 
(horizontal axis) and the signal level of another waveform (waveform that has the display turned ON) on the Y-axis (vertical 
axis). Simultaneous observation of an X-Y waveform and a normal T-Y waveform (waveform using time axis and signal level) 
is also possible. Up to 16 X-Y waveforms can be displayed overlapped. The display of multiple X-Y waveforms facilitates the 
comparison of the relative phase. This function can be used to evaluate DC motors using Lissajous waveforms.

Waveform Computation

Chapter 10, "Waveform Computation" in the user's manual

Addition, subtraction, multiplication, division (+, –, ×, /), binary computation, FFT (power spectrum), and phase shift (display 
or compute by shifting the waveform phase) are possible. Up to eight computations can be set.

Содержание SL1400 ScopeCorder LITE

Страница 1: ...IM 701240 02E 2nd Edition ScopeCorder LITE SL1400...

Страница 2: ...s performance and functions The figures given in this guide may differ from those that actually appear on your screen Every effort has been made in the preparation of this guide to ensure the accuracy...

Страница 3: ...ditions 18 Changing the Trigger Settings 21 Measuring Waveforms 24 Zooming the Waveform along the Time Horizontal Axis 25 Recording T Y Time Amplitude Waveforms 26 Setting the Recorder Mode to Chart R...

Страница 4: ...s by specifying the magnification zoom rate MANUAL TRIG key Section 6 19 Press the key to forcibly activate a trigger Trigger indicator Illuminates when a trigger is activated Jog shuttle Used to set...

Страница 5: ...y memory function Sequentially stored waveforms can also be displayed and searched MEASURE key Sections 11 5 and 11 6 Displays a menu used to perform automated measurement of waveform parameters and s...

Страница 6: ...inuous writing to hard disk Acquisition mode Section 7 2 Sample rate Section 5 2 Trigger level Section 6 5 Ground level Channel number of the scale value Scale value of the vertical axis Section 8 9 V...

Страница 7: ...ivision of Z2 T div of Z1 Time per division of Z1 Normal waveform display area Zoom waveform display area Zoom box Z2 indicating the zoom range and position of Z2 Display area of Z1 Display area of Z2...

Страница 8: ...he soft key corresponding to the displayed selection Setup menu Soft keys Type in which the jog shuttle is used to select items menu with or icon Press a soft key to set a menu under jog shuttle contr...

Страница 9: ...a USB Mouse in the user s manual Tips By connecting a USB mouse to the USB PERIPHERAL connector on the side panel you can use a USB mouse to perform the same operations as you would using the front pa...

Страница 10: ...activated when the specified timeout time is reached Period trigger A trigger is activated when the period of the signal matches the specified condition Window trigger A trigger is activated when the...

Страница 11: ...e Horizontal Axis Section 8 5 Zooming and Auto Scrolling the Waveform in the user s manual The displayed waveform can be expanded along the time horizontal axis Two locations can be zoomed at once Thi...

Страница 12: ...opped the X Y waveforms during the waveform acquisition period can be recorded If auto print is specified the recording of the X Y waveforms starts when waveform acquisition is stopped The waveform ca...

Страница 13: ...ocessing results Max Maximum value Min Minimum value Avg Average value Sdv Standard deviation Cnt Number of measured values used in the statistical processing The following three statistical processin...

Страница 14: ...ealtime recording area 30 to 70 of the total capacity Data storage area Copy SCSI GP IB interface Ethernet interface USB interface Internal hard disk Ethernet Communications Chapter 15 Ethernet Interf...

Страница 15: ...panel Module Right side panel Attach a cover plate in slots in which no modules are installed Connecting the Power Supply Section 3 4 Connecting the Power Supply and Turning ON OFF the Power Switch i...

Страница 16: ...es and the cautions given in section 3 8 Compensating the Probe Phase Correction in the user s manual before connecting the probe Connect the probe to the input terminal CH1 of the SL1400 Connect the...

Страница 17: ...the waveform and perform waveform analysis on the screen using the history memory and waveform computation functions RECORD START STOP MODE Displaying Waveforms on the Screen This section explains th...

Страница 18: ...ngs The stored setup data is also initialized see section 13 1 in the user s manual Turn ON the power switch while holding down the RESET key Performing Auto Setup Section 4 5 Performing Auto Setup in...

Страница 19: ...Chart Recorder mode Approx 1 kHz to 1 MHz in X Y Recorder mode Type Repetitive waveform that is not complex Changing the Waveform Display Conditions This section explains the procedure to change the s...

Страница 20: ...screen is displaying the range between 1 000 V and 1 000 V around the ground level Ground level mark Upper limit 1 000 V Lower limit 1 000 V Lower the Vertical Position to View the Entire Waveform Am...

Страница 21: ...ample Rate in the user s manual The record time refers to the length of time displayed on one screen 1 Press MENU 2 Press the ACQ soft key 3 Press the Record Time soft key 4 Turn the jog shuttle clock...

Страница 22: ...level Trigger mode Trigger mode specifies the conditions timing or count for updating the displayed waveform If auto setup is performed the trigger mode is set to auto There are six trigger modes For...

Страница 23: ...Section 6 2 Setting the Trigger Position in the user s manual 1 Press MENU 2 Press the Trigger soft key 3 Press the Position soft key 4 Turn the jog shuttle counterclockwise to set the trigger positi...

Страница 24: ...is suited for observing single shot signals 1 Press MENU 2 Press the Trigger soft key When the waveform acquisition stops Running changes to Stopped 3 Display the selection menu and select Single In...

Страница 25: ...f cursor 1 and cursor 2 2 Display the selection menu and select Vertical CURSOR Vertical cursor 1 Vertical cursor 2 Note Cursor types When X Y waveforms are not displayed Horizontal cursors Measures t...

Страница 26: ...huttle to set the zoom rate of Z1 Set the time length to be displayed in the zoom waveform window as the zoom rate 5 Likewise set Z2 Mag If the jog shuttle control is set to both Z1 Mag and Z2 Mag the...

Страница 27: ...ting Probes on page 15 in this operation guide Setting the Recorder Mode to Chart Recorder Section 9 1 Selecting the Recorder Mode in the user s manual 2 Press MODE 3 Press the Chart Recorder soft key...

Страница 28: ...e below You cannot restore the settings The stored setup data is also initialized see section 13 1 in the user s manual Turn ON the power switch while holding down the RESET key Displaying Recording o...

Страница 29: ...ANGE knob clockwise to set the voltage range to 5 00 V Voltage range setting of CH1 Note If you want to change the voltage range measurement range of a channel other than CH1 press select the desired...

Страница 30: ...ge of the waveform display area at the top This mark points to the right most position of the waveform display area and indicates the position where the waveform acquisition was stopped In this exampl...

Страница 31: ...rm Below is a recording example Date time when the waveform recording acquisition was started Fri Sep 15 16 37 30 2006 Chart speed 20 mm sec T div time per division 500 ms div Scale value of CH1 2 500...

Страница 32: ...ine waves with an amplitude of approximately 5 V and frequency of approximately 1 Hz and 4 Hz to the input terminal of CH1 and CH2 For the procedure to connect the probe to the input ter minal see Con...

Страница 33: ...existed immediately before the initialization 1 Press MENU 2 Press the Next 1 2 soft key 3 Press the INITIALIZE CAL soft key MENU Note When you initialize the display of all channels in which modules...

Страница 34: ...jog shuttle to move the cursor to 5V 5 Press key to confirm Voltage range setting Top section Voltage range before the change voltage range that can be changed before the voltage range is changed Bott...

Страница 35: ...tomatically stored to the internal memory This data can be used to reprint the waveform on the built in printer or saved to the internal hard disk or external storage medium as a PDF file see section...

Страница 36: ...ss to turn it ON By default it is turned ON 1 Press MENU 2 Press the RECORD COND soft key 3 Press the Print Setup soft key 6 Turn the jog shuttle to move the cursor to CH1 at row XY1 and column X Trac...

Страница 37: ...e Y axis upper limit 2 500 V Scale value of the Y axis lower limit 2 500 V Scale value of the X axis left most value 2 500 V Scale value of the X axis right most value 2 500 V Voltage range measuremen...

Страница 38: ...f auto print is turned ON according to the procedure given on page 34 in this operation guide recording does not start by default Below is a recording example Sample rate 5 kS s Y axis scale value of...

Страница 39: ...Section 12 1 Printing on the Built in Printer in the user s manual Waveforms displayed on the screen are printed as shown The printer icon at the upper left of the screen blinks while the im age is be...

Страница 40: ...with a file name consisting of a four digit sequence number starting from 0000 and extension You can save the screen image data by simply carrying out step 8 skipping steps 1 to 7 By default the imag...

Страница 41: ...ium 6 Press key to confirm 7 Press the Save Exec soft key The save operation is executed Drive name of the storage medium See the previous page These settings are not changed in this operation guide A...

Отзывы: