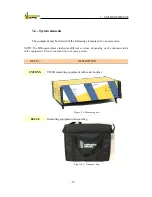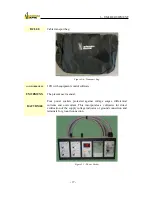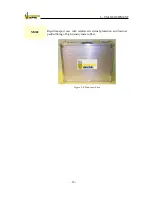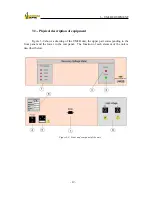
3.- UM2B EQUIPMENT
- 11 -
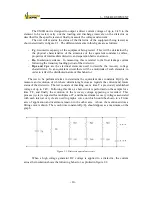
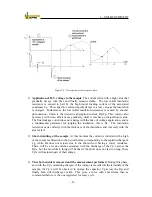
Figure 2-2: Description of the test procedure.
1)
Application of H.V. voltage to the sample
. The current starts with a high value that
gradually decays with time and finally remains stable. The low initial insulation
resistance is caused in part by the high initial loading current of the associated
condenser Cg. This capacitive current rapidly decays to a low value as the insulation
is charged. Furthermore, the low initial insulation resistance is caused by another
phenomenon, which is the dielectric absorption current, Rp/Cp. This current also
decreases with time, albeit more gradually, until it reaches an insignificant value.
The final leakage current does not change with the time of voltage application, and is
a fundamental parameter for judging the insulation, this is Ra. The insulation
resistance varies directly with the thickness of the insulation, and inversely with the
area tested.
2)
Short-circuiting of the sample
. At this moment the current is initiated with a high
value in inverse direction to the period before corresponding to the rapid discharge of
Cg, while Ra does not actuate due to the short-circuit having a lower resistance.
There will be a weak current associated with the discharge of the Cp‟s across the
Rp‟s, but the most likely thing will be that if the short does not last too long, these
Cp‟s will maintain part of their charge.
3)
The short-circuit is removed and the measurement performed
. During this phase,
and with the Cp‟s remaining charged, if the voltage is recorded at the terminals of the
sample, the Cp‟s will be observed to charge the capacitor Cg across the Rp, and
finally both will discharge via Ra. This gives a curve with a maximum that, as
commented before, is the one registered for every cycle.
Содержание UM2B
Страница 2: ......
Страница 49: ...5 SOFTWARE DESCRIPTION 47 Figure 5 18 Warning message Figure 5 19 a Measurement Screen Recovery Voltage ...
Страница 67: ...5 SOFTWARE DESCRIPTION 65 Figure 5 46 a First page of the report Recovery Voltage ...
Страница 68: ...5 SOFTWARE DESCRIPTION 66 Figure 5 47 a Second page of report Recovery Voltage ...
Страница 69: ...5 SOFTWARE DESCRIPTION 67 Figure 5 48 Third page of report Recovery Voltage ...
Страница 70: ...5 SOFTWARE DESCRIPTION 68 Figure 5 46 b First page of the report Insulation Resistance ...
Страница 71: ...5 SOFTWARE DESCRIPTION 69 Figure 5 47 b Second page of the report Insulation Resistance ...
Страница 87: ...8 TECHNICAL SUPPORT 85 Description of fault Materials returned on of of the year Table 8 1 ...
Страница 95: ...APPENDIX B CONTROL SOFTWARE 93 APPENDIX A CE CONFORMITY DECLARATION ...


