5.- SOFTWARE DESCRIPTION
- 58 -
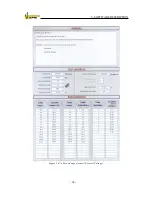
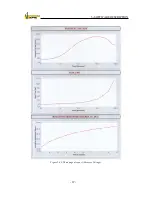
Below the table of values of the graphic there is a selector which may be used to
select the type of curve to be used to display the recovery voltage. Three display modes may
be chosen: Linear curve (Figure 5-38), on which each point sampled is connected to the
adjacent points by a straight line; Interpolated curve (Figure 5-39), where the points are
connected by curves; and Both (Figure 5-40), with the linear and interpolated curves
displayed on the same graphic.
Figure 5-39: Recovery graph: Interpolated plot.
Figure 5-40: Recovery graph: both plot.
Содержание UM2B
Страница 2: ......
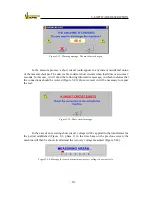
Страница 49: ...5 SOFTWARE DESCRIPTION 47 Figure 5 18 Warning message Figure 5 19 a Measurement Screen Recovery Voltage ...
Страница 67: ...5 SOFTWARE DESCRIPTION 65 Figure 5 46 a First page of the report Recovery Voltage ...
Страница 68: ...5 SOFTWARE DESCRIPTION 66 Figure 5 47 a Second page of report Recovery Voltage ...
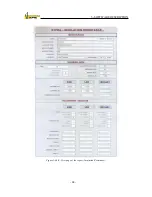
Страница 69: ...5 SOFTWARE DESCRIPTION 67 Figure 5 48 Third page of report Recovery Voltage ...
Страница 70: ...5 SOFTWARE DESCRIPTION 68 Figure 5 46 b First page of the report Insulation Resistance ...
Страница 71: ...5 SOFTWARE DESCRIPTION 69 Figure 5 47 b Second page of the report Insulation Resistance ...
Страница 87: ...8 TECHNICAL SUPPORT 85 Description of fault Materials returned on of of the year Table 8 1 ...
Страница 95: ...APPENDIX B CONTROL SOFTWARE 93 APPENDIX A CE CONFORMITY DECLARATION ...


