


3.
Select or add a dye, then select a filter set appropriate for your dye's wavelength
(see filter-wavelength table below).
Note:
See your reagent kit documentation for dye name and wavelength
information.
Peak filter
Filter wavelength (nm)
[1]
Excitation
Emission
x1-m1
470 ± 15
520 ± 15
x2-m2
520 ± 10
558 ± 12
x3-m3
550 ± 10
587 ± 10
x4-m4
580 ± 10
623 ± 14
x5-m5
640 ± 10
682 ± 14
x6-m6
662 ± 10
711 ± 12
[1]
The central wavelengths are the optimized wavelengths.
IMPORTANT!
If the selected filter set does not match your reagent kit
documentation, then the incorrect wavelength may be collected during a run.
4.
(Optional)
Tap
Reagents
, then enter the reagent information.
5.
Load the plate into the instrument
6.
Tap
Start
.
7.
When the run is complete and the screen displays
Calibration complete
, tap
View results
4
Details
.
8.
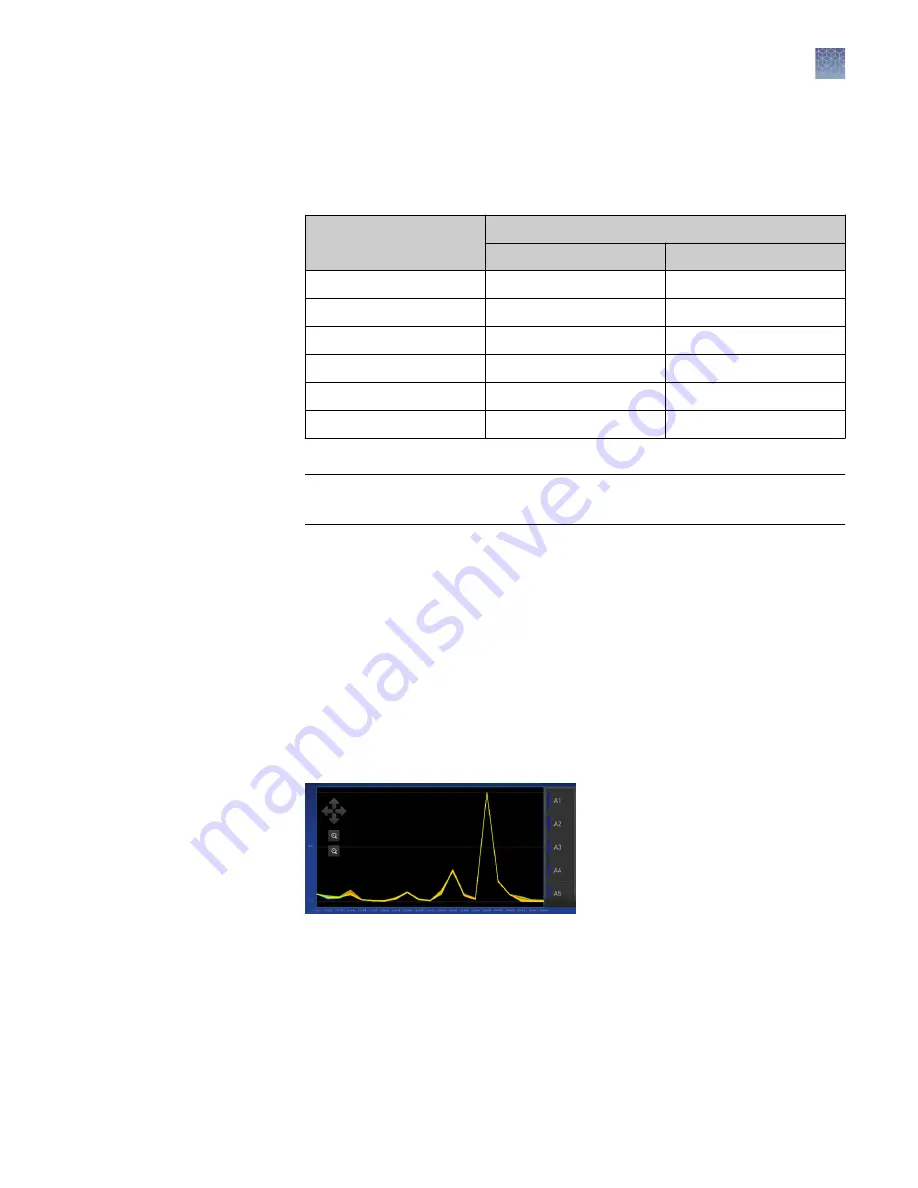
Review the plot.
Passing calibration results show uniform signals with peaks that are aligned with
the dye wavelength.
Figure 15 An example dye calibration plot
Note:
The peaks for your dye may align with a different filter set.
Chapter 7
Calibrate and verify instrument performance
Calibrate for a custom melt curve run
7
QuantStudio
™
6 Pro and 7 Pro Real-Time PCR Systems User Guide
105
Содержание QuantStudio 6 Pro
Страница 215: ......
Страница 216: ...thermofisher com support thermofisher com askaquestion thermofisher com 27 April 2020...


