Description of the “Evaluation” View
Page 85
6.1.1
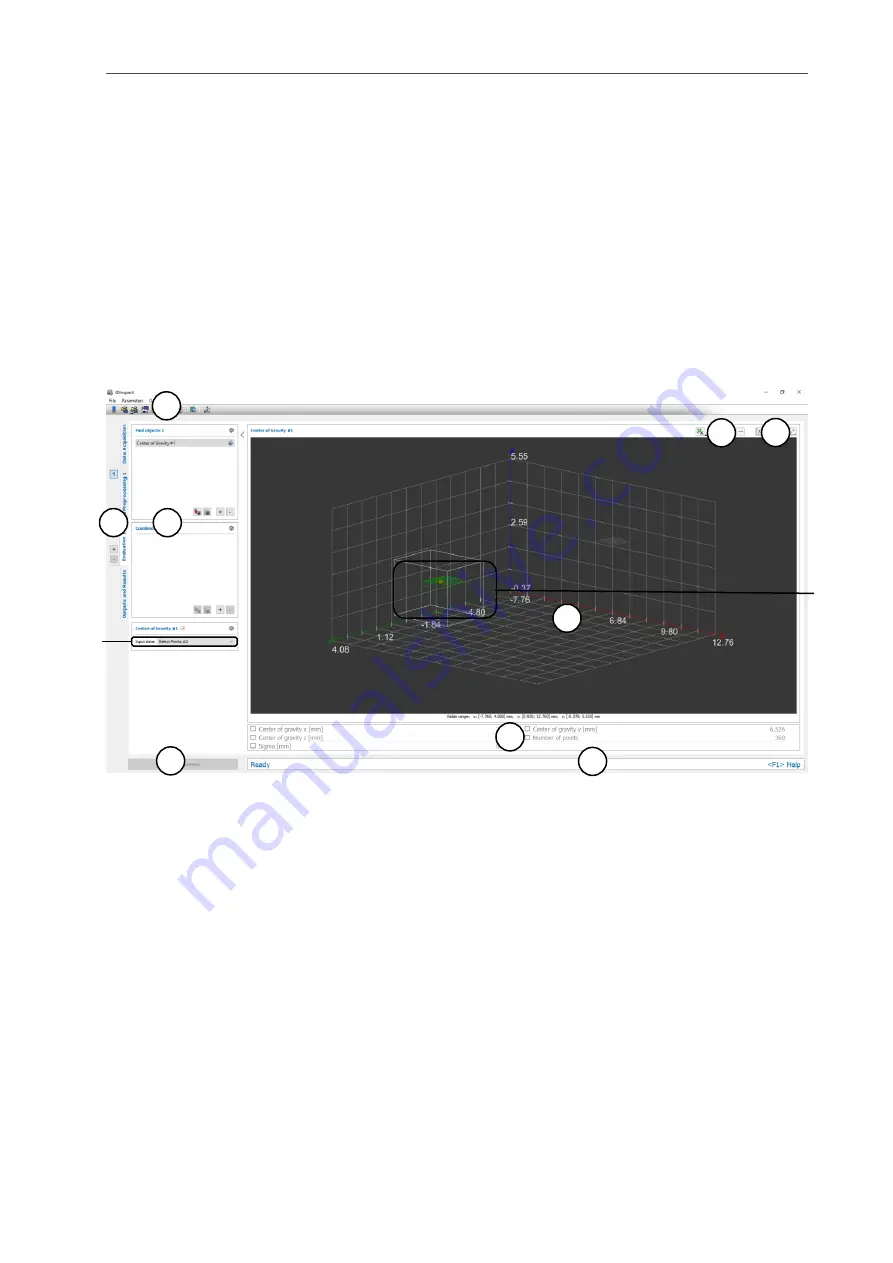
“Center of Gravity” Measuring Program
Use the “Center of Gravity” program to calculate the center of gravity of 3D points. Proceed as follows:
-
If applicable, select the input data for the program (see below, section “1” and Chap.
-
If necessary, limit the range for the center of gravity calculation in order to eliminate interfering
points (see section “E” and Chap.
and
-
If applicable, select measured values that are to be used later for calculation, OK/nOK assessment,
logging and output (see below, section “H” and Chap.
The measuring program outputs the following measured values:
-
Center of gravity x: The X coordinate of the calculated center of gravity of the current point cloud.
-
Center of gravity y: The Y coordinate of the calculated center of gravity of the current point cloud.
-
Center of gravity z: The Z coordinate of the calculated center of gravity of the current point cloud.
-
Number of points: The number of selected points in the current point cloud that were used to cal-
culate the center of gravity.
-
Sigma: The standard deviation of the distances of the points to the center of gravity.
Fig. 6.3: “Center of Gravity” Measuring Program
Display Elements and Parameters in the “Center of Gravity” Program:
A
“General” toolbar: Using this toolbar, you can select the data source (see Chapter
save and load parameters and reset selected parameters to default settings (see Chapter
).
B
List of active measuring programs: This section displays the active measuring programs from
the “Find objects” and “Combine objects” groups. You can add and remove measuring pro-
grams/measuring program groups (see Chap.
), move measuring programs (see
) and select an active measuring program for parameterizing and displaying the
measured values.
C
Measuring program groups / Tab bar for switching between views: This tab bar allows you
to switch between the four main views (see Chap.
). To the left of the tab bar you find the sec-
tion for adding, removing and selecting measuring program groups (see Chap.
D
3D-View: The 3D-View visualizes the 3D data (see Chap.
E
Measuring toolbar: Use this toolbar to set various ROIs for the measurement (see Chap.
and
F
3D-View toolbar: Use this toolbar to configure the orientation of the coordinate system in the
3D-View (see Chap.
A
B
C
I
G
E
D
F
H
1
2
Содержание reflectCONTROL RCS
Страница 1: ...3DInspect 1 1 Instruction Manual ...
Страница 25: ...Working with 3DInspect Page 25 ...
Страница 72: ...Description of the Data Preprocessing View Page 72 ...
Страница 74: ...Description of the Data Preprocessing View Page 74 ...
Страница 129: ...Appendix Page 129 ...
Страница 133: ......