56
LogTag Analyzer User Guide (2.0)
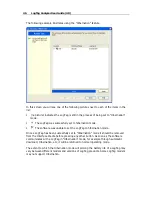
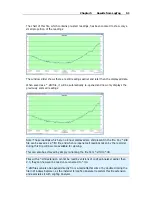
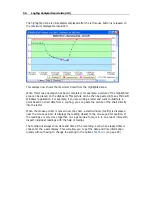
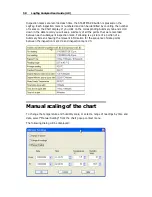
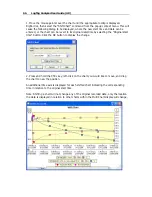
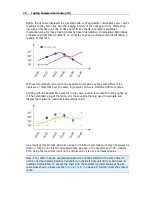
The highlighted zone is immediately displayed after the left mouse button is released on
the maximum displayable resolution:
This display now shows the maximum detail from the highlighted area.
When this mouse operation has been completed, for example, a picture of the highlighted
area can be placed on the clipboard. This picture can be then be pasted into any Microsoft
Windows
®
application. For example, if you are writing a letter and want to illustrate a
point based on chart data from a LogTag, you can paste the picture of the chart directly
into the letter.
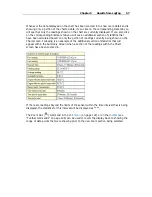
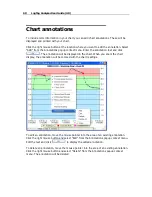
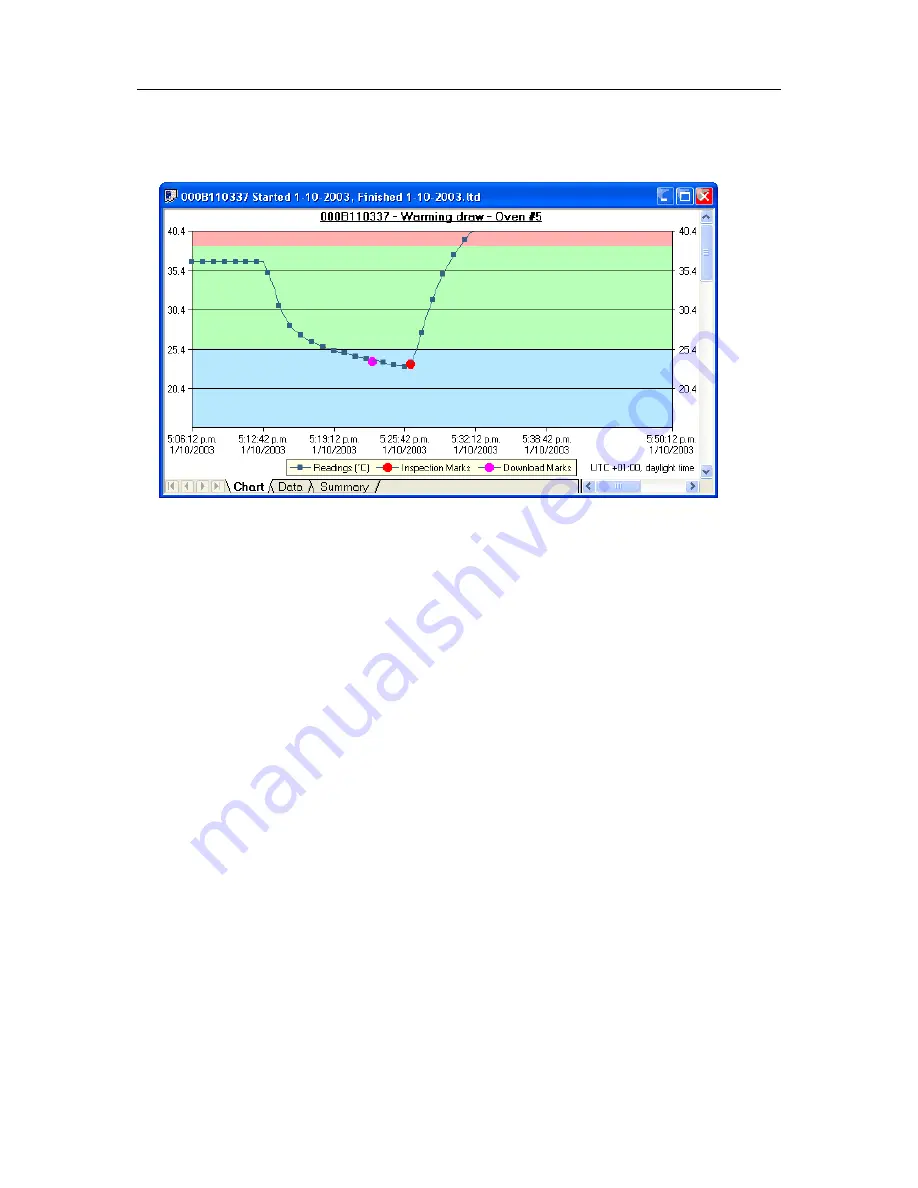
When the mouse pointer is moved over the chart, a small window (tooltip) is displayed
near the mouse pointer. It displays the reading closest to the mouse pointer position. If
the readings are very close together, it is a good idea to zoom in to an area of interest to
inspect individual readings with the help of tooltips.
The tooltip will always show date and time of the recording, even when elapsed time is
chosen for the x-axis display. This will allow you to get the date and time information
quickly without having to change the setting in the options for
Charts
(on page 90).
Содержание Analyzer
Страница 1: ...2 0...
Страница 23: ...Chapter 3 Quick Start Guide 23 Only flashes if no alert condition is present...
Страница 170: ......

